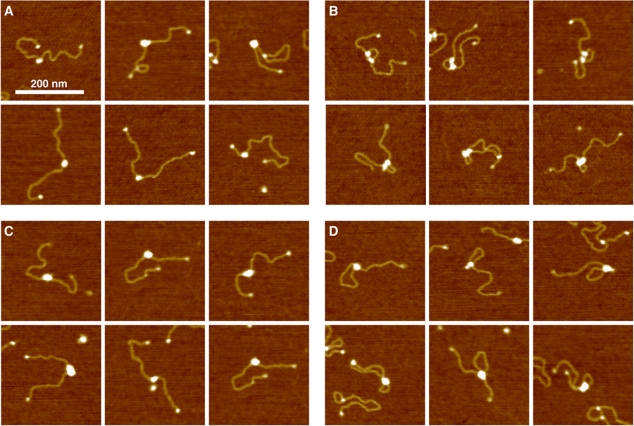
Figure 3.
AFM images showing single-site binding and loop binding of MutS to heteroduplex DNA. (A, B) Images of MutS deposited in the absence of nucleotide. Images in (A) show MutS single-site binding on DNA; those in (B) show MutS loop binding. (C, D) Images of MutS deposited in the presence of 0.5 mM ATP. Images in (C) shows MutS single-site binding on DNA, while (D) shows loop binding. In both cases, the ends of DNA were previously bound with streptavidin. The scale bar indicates 200 nm.

