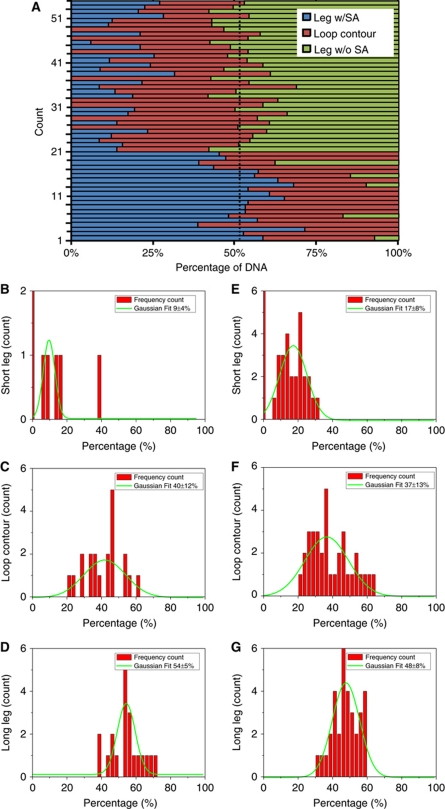
Figure 6.
Normalized length distributions for MutS bound in loop configuration to heteroduplex DNA containing biotin at a single DNA end in the presence of ATP. MutS (100 nM) and 1120-bp G-T mismatch DNA (20 nM) that contained biotin at the end further from the mismatch site and that had been previously bound with monovalent streptavidin (see Materials and Methods) were incubated in 20 mM Tris–HCl (pH 7.5), 100 mM K+ glutamate, 5 mM MgCl2, and 0.4 mM DTT for 10 min at room temperature in the presence of ATP. Panel (A) shows the contour lengths of each segment on individual DNA molecules. The colours of these segments have the same means as Figure 5. Two sets of loops can be observed from panel (A). Set one: the loops are between MutS and biotinylated ends, and set two: the loops are between MutS and free ends. The histograms (B–D) and (E–G) show Gaussian fits of the contour length data of these two sets of loops, respectively.

