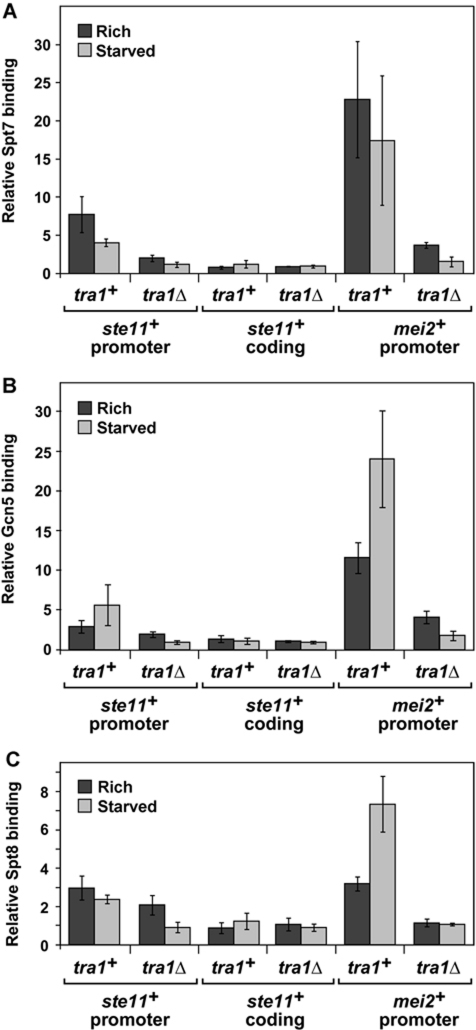
Figure 7.
Tra1 contributes to the recruitment of SAGA to the promoters of ste11+ and mei2+ in nutrient-rich and starved conditions. Spt7 (A), Gcn5 (B), or Spt8 (C) occupancy was assessed by ChIP analysis of chromatin extracts from strains in which each protein was myc-tagged either in a wild-type or in a tra1Δ background. Cells were grown to mid-log phase in minimal medium in the presence of nutrients, and then shifted for 4 h to either rich medium (dark grey) or starvation medium (light grey). Occupancy levels were quantified by real-time PCR of anti-myc IP over input DNA and normalized to background levels detected at a non-transcribed region (mat3), which are set at 1. The coordinates of the promoter and coding regions that were tested are provided in Supplementary Table 6. The background %IP values obtained from ChIP analysis of the corresponding ‘no tag’ strains are shown in Supplementary Figure S8C. Each column represents the mean relative %IP value±s.e. (n=4–6).

