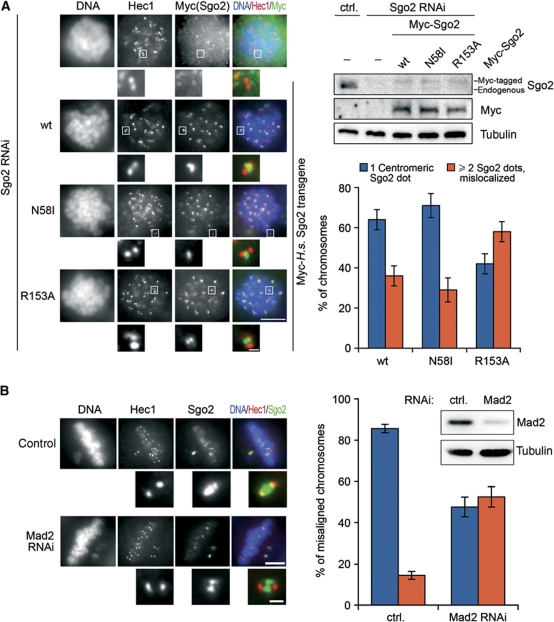
Figure 6.
Fine-tuning of Sgo2 localization by Mad2 binding. (A) Splitting of the centromeric signal for a Mad2-binding deficient Sgo2 mutant. GL2 (ctrl.) or Sgo2 siRNA-treated cells were additionally transfected either with empty vector (−) or with plasmids encoding siRNA-resistant Myc-tagged Sgo2-wt, -N58I or -R153A. Cells were arrested in mitosis with nocodazole and analysed by fluorescence microscopy as labelled on top (left panels) or by western blot using Sgo2-, Myc- and α-tubulin antibodies (upper right panels). Taking into account the relatively high transfection efficiency, we estimate that Sgo2 transgenes were not expressed above physiological levels. Scale bars are 10 μm in the large panels and 0.5 μm in the close-up images of kinetochores/centromeres. The graph shows a quantification of the observed phenotypes (three independent experiments, n>1000 chromosomes each, error bars: s.d.). (B) Centromeric Sgo2 immunofluorescence signals split into two upon depletion of Mad2. HeLa cells were transfected with either control (ctrl.=GL2) or Mad2 siRNA and cultured for 24 h. A low concentration of nocodazole (10 ng/ml) was added and 3 h thereafter cells were analysed by Mad2- and α-tubulin western blots (upper right panels) or fixed and stained for the indicated markers (left panels). Individual misaligned chromosomes from >160 metaphase cells and two independent experiments were selected and quantitatively analysed for centromeric Sgo2 localization (graph on right; error bars: s.d.). Scale bars are as in (A).

