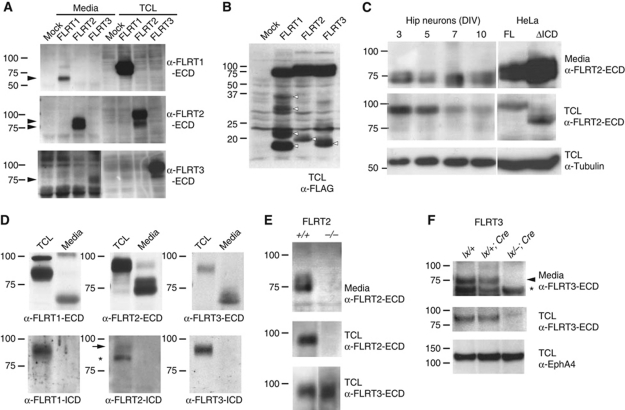
Figure 1.
FLRT ECDs are shed from transfected cells and neurons. (A, B) Western blot analysis of lectin pull-down (glycoprotein enriched) samples from 2 DIV conditioned media (Media) or of corresponding total cell lysates (TCL in A, B) of HEK293T cells transfected with C-terminally FLAG-tagged FLRT1, FLRT2, FLRT3 or Mock transfected. Samples were analysed using antibodies against the ECD of FLRTs or FLAG as indicated. Arrowheads in (A) point to the FLRT ECDs (one species for FLRT1 or FLRT3, doublet for FLRT2). Various protein species in the range of 18–35 kDa were found in the TCL (arrowheads in B). (C) Same analysis as in (A) of dissociated E17.5 hippocampal neurons kept in culture for the indicated DIV or HeLa cells transiently transfected with C-terminally FLAG-tagged full-length FLRT2 (FL) and FLRT2 lacking the intracellular domain (ΔICD). Anti-tubulin levels in TCLs are shown as loading controls. (D) Detection of shed FLRT1–3 ECDs in 6 DIV conditioned media of E16.5 cortical neurons. FLRT1–3 ECDs are visible in blots probed with anti-ECD antibodies (upper panels) but not with anti-ICD antibodies (lower panels). The positions of full-length FLRT2 (arrow) and of a non-specific band (asterisk) are indicated (see FLRT2–/– control in Figure 2B). (E, F) Mouse mutants demonstrate specificity of the ECD signals. (Upper panels) Western blot analysis of glycoprotein enriched samples of 7 DIV conditioned media from CA1 hippocampal explants (E) or dissociated cortical neurons (F) of the indicated genotypes using anti-FLRT2/3 ECD antibodies. (Middle panels) Corresponding glycoprotein enriched TCL probed with anti-FLRT2/3 ECD antibodies. (Lower panel) Corresponding glycoprotein enriched TCL probed with a loading control (anti-FLRT3 ECD in (E) and anti-EphA4 in (F)). Arrowhead and asterisk in (F) indicate FLRT ECD and a non-specific band, respectively (see also Supplementary Figure S1).

