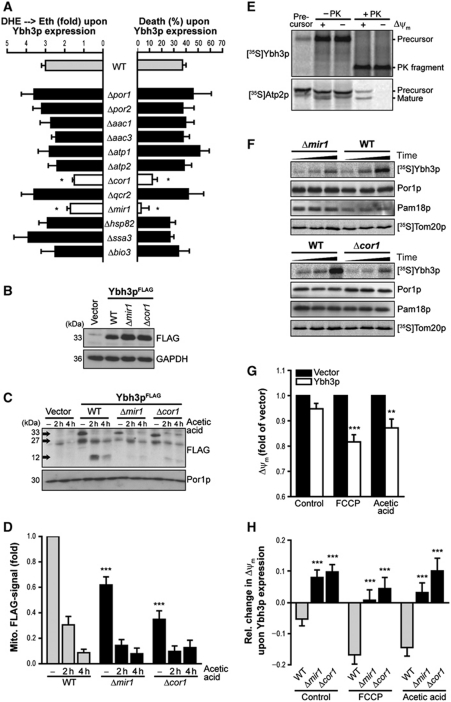
Figure 6.
Mir1p and Cor1p facilitate mitochondrial import of Ybh3p as well as Ybh3p-mediated breakdown of mitochondrial membrane potential and subsequent cell death. (A) Death and ROS accumulation of wild-type (WT) cells and indicated deletion mutants overexpressing Ybh3p upon treatment with 120 mM acetic acid. Percentage of death as well as fold of DHE → Eth conversion mediated by overexpression of Ybh3p compared with corresponding isogenic vector control was plotted (mean±s.e.m., n=6–8). (B) Immunoblot analysis of Ybh3pFLAG expression in WT, Δmir1 and Δcor1 cells. (C, D) Representative immunoblot (C) and quantification of mitochondrial full-length Ybh3pFLAG normalized to porin (Por1p, mitochondrial loading control) (D) in mitochondrial fractions isolated from WT, Δmir1 and Δcor1 cells overexpressing Ybh3pFLAG treated 120 mM with acetic acid for 2 and 4 h or left untreated (mean±s.e.m., n=12). (E) [35S]-labelled precursor proteins were incubated with yeast mitochondria followed by treatment with proteinase K (+ PK). Plus and minus signs denote whether Δψm had been dissipated prior to the import reaction. (F) Yeast mitochondria isolated from WT, Δmir1 and Δcor1 cells were incubated with [35S]-labelled Ybh3p for 1, 5 and 25 min or with [35S]-labelled Tom20p for 1, 4 and 20 min followed by carbonate extraction (pH 10.5) and analysis by NuPAGE and autoradiography. In addition, mitochondrial carbonate resistant pellets from the Ybh3p import reactions were analysed for Por1p and Pam18p as markers for outer and inner membrane using immunoblotting. (G) Measurement of Δψm using TMRM in yeast cells overexpressing Ybh3p or harbouring the empty vector. Cells were treated or not with acetic acid or FCCP before flow cytometric analysis. TMRM fluorescence upon Ybh3p overexpression compared with similarly treated vector control was indicated (mean±s.e.m., n=12). (H) Change of Δψm using flow cytometric assessment of TMRM fluorescence upon Ybh3p overexpression in WT, Δmir1 and Δcor1 cells treated with acetic acid or FCCP or left untreated. Fold change compared with isogenic vector control was plotted (mean±s.e.m., n=12). See also Supplementary Figure S6 and Supplementary Table S1. *P<0.05, **P<0.01 and ***P<0.001.

