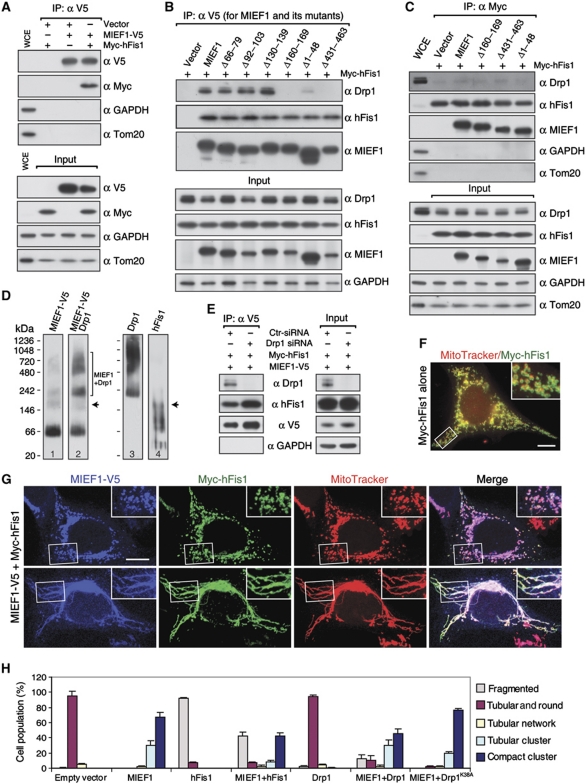
Figure 8.
The interaction of MIEF1 with hFis1 is independent of its interaction with Drp1 and overexpression of hFis1 partially reverses the MIEF1-induced mitochondrial fusion phenotype. (A) Cell lysates of 293T cells cotransfected with indicated plasmids were subjected to IP with anti-V5 agarose, and the precipitated complexes were immunoblotted with indicated antibodies. (B) MIEF1-V5 deletion mutants with no or reduced Drp1 binding (MIEF1Δ160−169 and MIEF1Δ431−463) and the cytoplasmic MIEF1Δ1−48 mutant had no effect on the binding between MIEF1 and hFis1. Cell lysates of 293T cells cotransfected with Myc-hFis1 and indicated MIEF1-V5 wild-type and mutant plasmids were subjected to IP with anti-V5 agarose and the precipitated complexes were immunoblotted with indicated antibodies. (C) Cell lysates of 293T cells cotransfected with Myc-hFis1 and indicated MIEF1-V5 wild-type and mutant plasmids were immunoprecipitated with anti-Myc agarose and the precipitated complexes were immunoblotted with indicated antibodies. (D) Native complexes of MIEF1, Drp1 and hFis1 were determined by NGE. Lysates from cells transfected with MIEF1-V5 and crosslinked with DSS (1 mM) were subjected to NGE followed by immunoblotting with indicated antibodies. Note: Lane 2 is the same blot as lane 1 that was reprobed with anti-Drp1 antibody after immunoblotting with anti-V5 antibody, and lanes 3 and 4 were probed using anti-Drp1 and hFis1 antibodies, respectively. (E) Cell lysates from Drp1 RNAi-treated HeLa cells cotransfected with MIEF1-V5 and Myc-hFis1 were subjected to IP with anti-V5 agarose, and the precipitated complexes were immunoblotted with indicated antibodies. (F) Confocal images of 293T cells transfected with Myc-hFis1 alone. Inset represents magnification of the boxed area. (G) Confocal images of 293T cells cotransfected with MIEF1-V5 and Myc-hFis1, and stained with MitoTracker followed by immunostaining with anti-V5 (blue) and anti-Myc (green) antibodies. Insets represent magnifications of the boxed areas. Bars, 10 μm. (H) Percentages (mean±s.e.m.) of cells with indicated mitochondrial morphologies in 293T cultures either transfected with empty vector (n=570), MIEF1-V5 (n=671), HA-Drp1 (n=405) and Myc-hFis1 (n=706) plasmid alone, or cotransfected with MIEF1-V5+HA-Drp1 (n=501), MIEF1-V5+HA-Drp1K38A (n=585) and MIEF1-V5+Myc-hFis1 (n=546) plasmids. Data were from three independent experiments.

