
Figure 3.
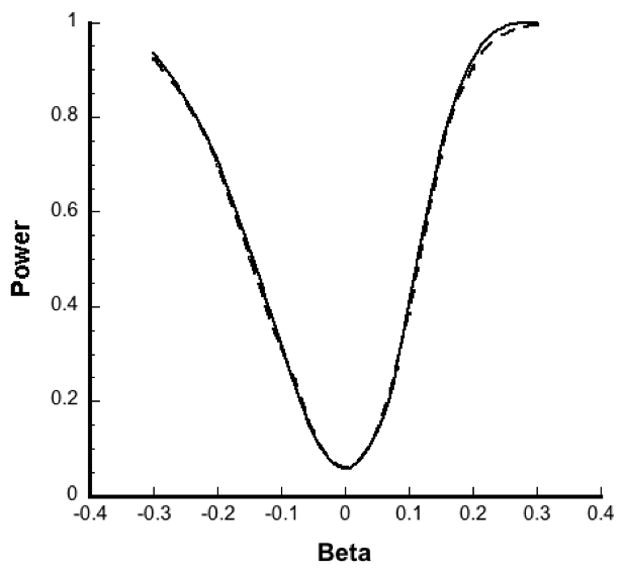
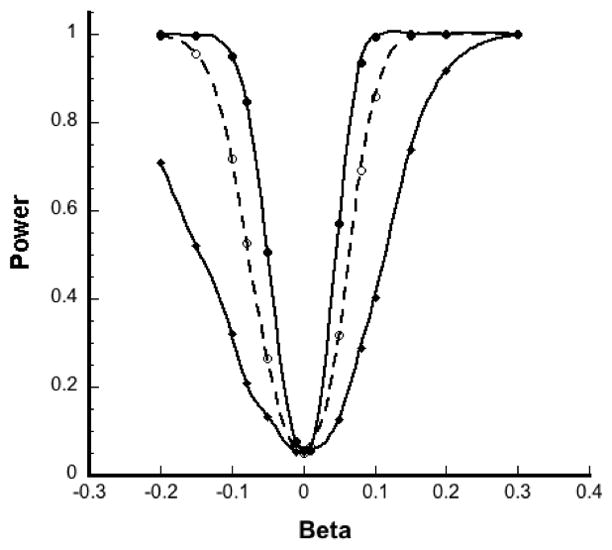
Simulated power curves (averaged over 1000 simulations) for β for unpooled and pooled analysis of exposure. (A) Power of unpooled analysis (solid line) and pooled analysis with g = 6 (dashed line) when sample size was fixed at 120 case-control pairs. (B) Power of unpooled analysis (solid line with diamonds), pooled analysis with g = 2 (dashed line) and g = 6 (solid line with bullets) when number of assays was fixed at 120 pairs, with α = 0.05.