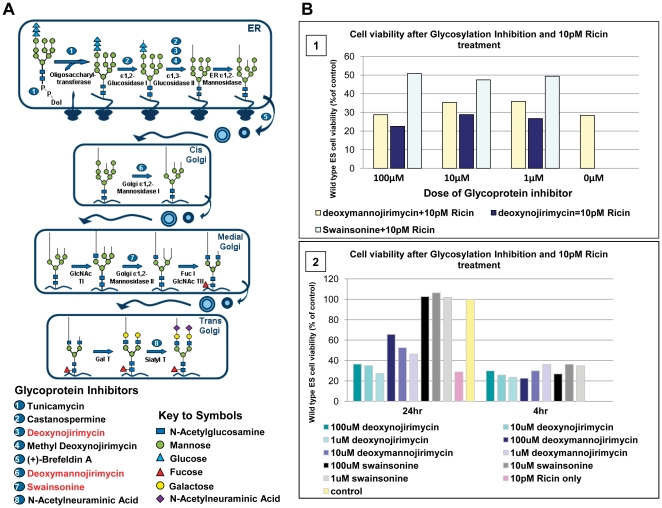
Figure 4. N-linked glycosylation pathway analysis.
A, diagram indicating steps and key inhibitors (numbered 1–8) involved in processing core sugar structures. B1 assay demonstrating neutral red viability data after naïve ES cells were treated with glycosylation inhibitors deoxynojirmycin (#3 in fig. 4A), deoxymannojirimycin (#6 in fig. 4A) or Swainsonine (#7 in fig. 4A) at 1, 10 or 100 µM 4 hours prior to, and during, exposure to 10 pM ricin for 3 days. B2, a comparison of neutral red viability data after naïve ES cells were treated with glycosylation inhibitors either 24 hours or 4 hours prior to, and during, ricin exposure.

