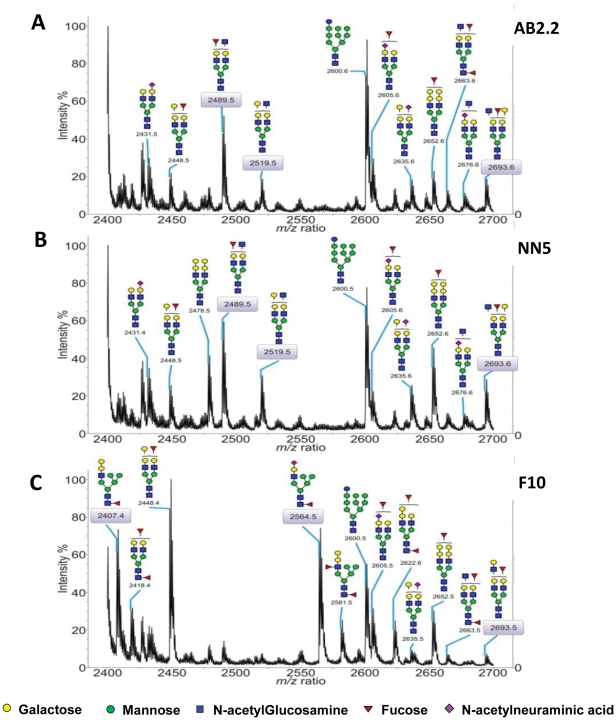
Figure 7. MALDI-TOF MS profiling of AB2.2, NN5 and F10 N-glycans (mz 2400–2700).
The expanded region (m/z between 2400 and 2700) is shown on the panels A, (AB2.2), B, (NN5) and C, (F10). N-glycans were permethylated prior being subjected to MS analysis and m/z values correspond to [M+Na]+ ions. Scheme assignments are based on the precise fit between composition calculations and the m/z (z = 1) ratio of the molecular ions detected. These schemes represent the most likely structures taking into account the biosynthetic pathways and the enzyme repertoire of murine cells and selected MS/MS analyses. Sugar symbols are those employed by the Consortium for Functional Glycomics. Circles represent hexoses (yellow: galactose, green: mannose), blue squares represent N-acetylglucosamine, red triangle: fucose, purple diamonds represent N-acetylneuraminic acid.

