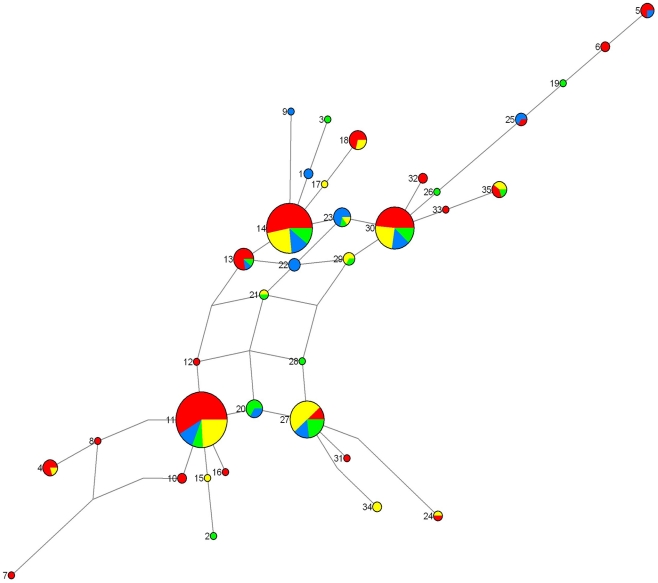
Figure 2. Median-joining network of Sodalis glossinidius haplotypes.
The network was based on 35 haplotypes. Filled circles indicate the haplotypes, the numbers identify the haplotypes, with the size of each circle proportional to the observed frequency. The colors within the circles correspond to the different populations – red: Ebimimbang; blue: Akak; green: Campo Beach/Ipono; yellow: Mabiogo – and the size of the pie charts is proportional to the occurrence in the populations. Median vectors (mutation step not present in the sampled population) are indicated by dotted lines.

