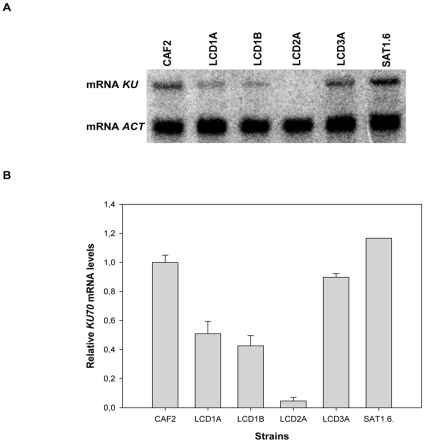
Figure 3. Analysis of the KU70 transcript levels in the mutant strains.
(A) A Northern blot analysis of KU70 transcripts in wild type CAF2 (KU70/KU70), heterozygotes LCD1A and LCD1B (KU70/ku70Δ), null mutant LCD2A (ku70Δ/ku70Δ) and reconstituted strains LCD3A (KU70/ku70::KU70) and SAT1.6 (ku70::KU70/ku70::KU70). The levels of actin (ACT1) mRNA were used as a loading control (lower panel). (B) The relative KU70 transcript levels were calculated (Material and Methods) and plotted.

