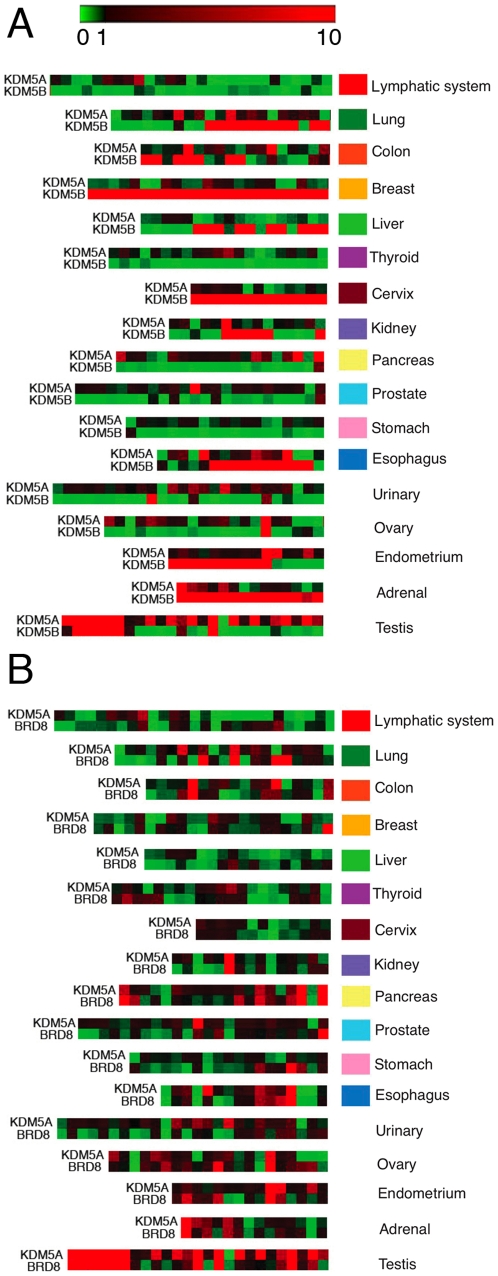
Figure 5. Expression levels of KDM5A, KDM5B and a KDM5A target gene in human tumors.
(A) KDM5A and KDM5B display highly tissue-specific expression patterns. The figure shows a heatmap of quantitative real-time PCR experiments in a panel of human tumor samples. Samples were arranged according to tumor grade, when information was available. Expression was normalized to the reference gene B2M and presented relative to the mean ΔCt of each gene. Heatmaps were produced using Gitools. The scale ranges from the minimum value of 0 (green), indicating low relative expression, to the mid-value of 1 (black) indicating an average level of expression, to the maximum value of 10 (red) indicating high relative expression. Columns represent different patient samples. (B) Expression of the KDM5A target gene BRD8 provides a readout of KDM5A transcript level. Sample annotation and expression values are presented in Table S9.

