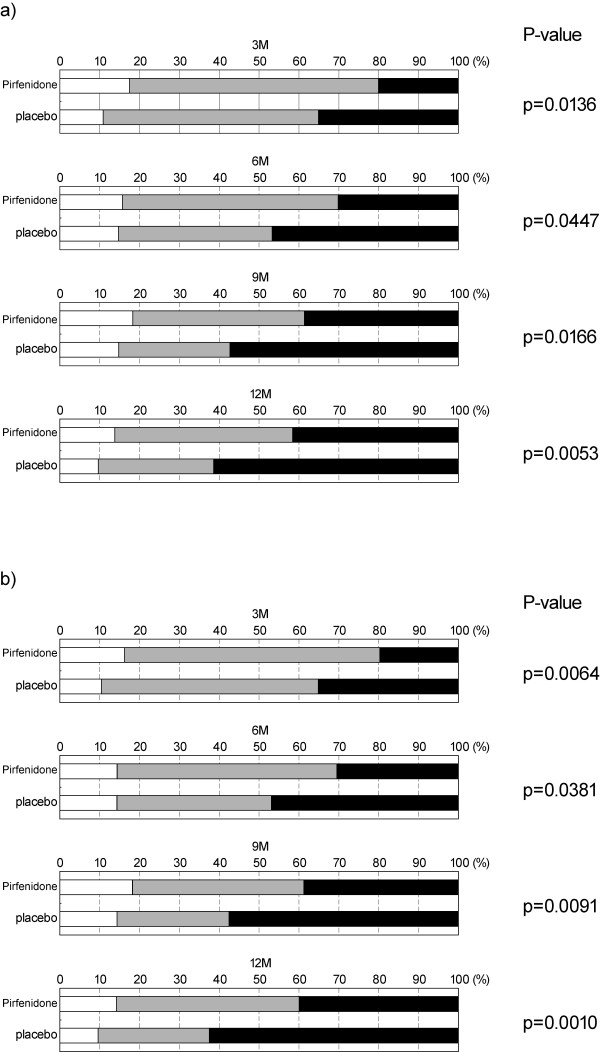
Figure 1.
Categorical analysis based on 5% changes in VC at months 3, 6, 9, and 12. Improvement ratings based on 5% changes in VC were defined as "improved (VC 5% increase)", "stable (VC < 5% change)", and "worsened (VC 5% decrease)", using VC values measured at months 3, 6, 9, and 12. a) high-dose vs. placebo groups, b) pirfenidone-treated (high + low-dose) vs. placebo groups. The results are shown by the frequencies of improved (white areas), stable (gray areas), and deteriorated (black areas). P-values by Wilcoxon's test are indicated at the right.

