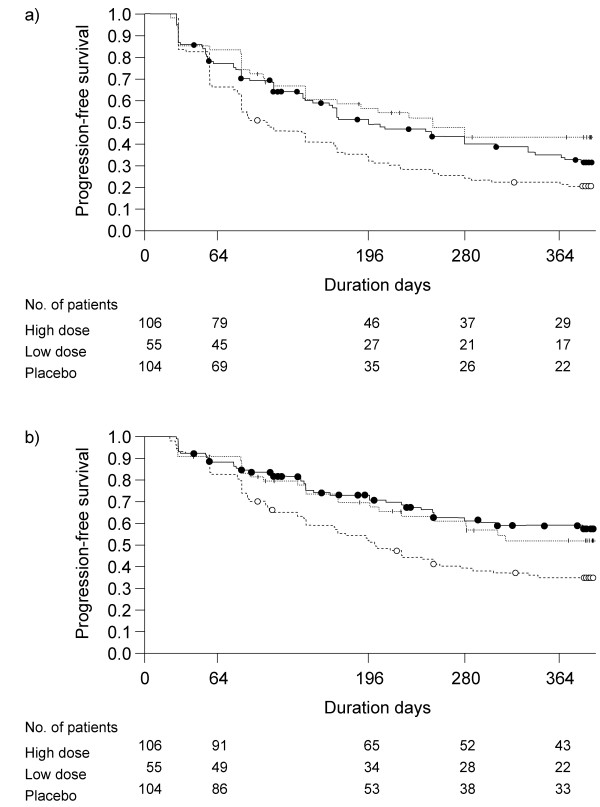
Figure 2.
Kaplan-Meier plot of Progression-Free Survival (PFS) times in groups of IPF patients. a) The disease progression was defined by a ≥ 5% decline in VC from baseline or death. b) The disease progression was defined by a ≥ 5% decline in VC from baseline on two consecutive occasions or death. Solid line: high-dose; broken line: low-dose; bold broken line: placebo. The distribution of PFS times were compared with log-rank test.

