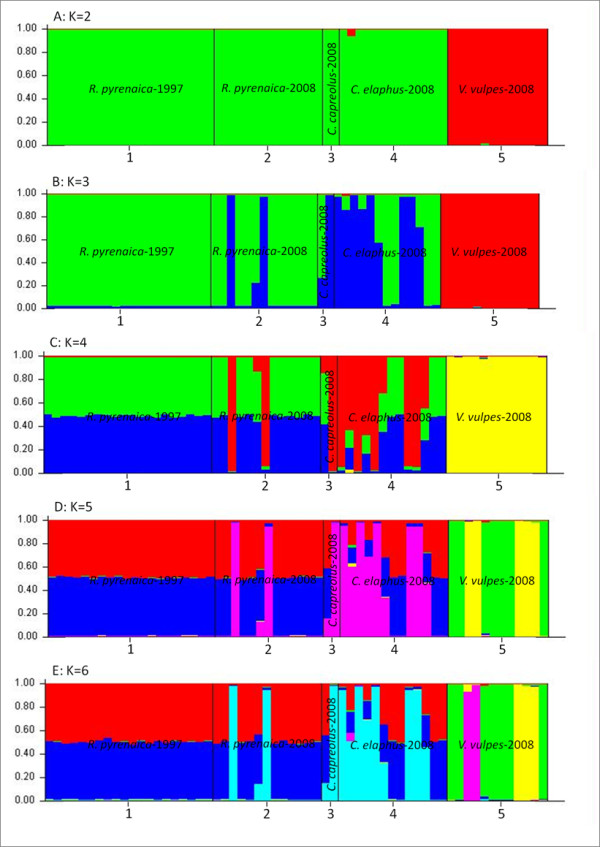
Figure 2.

Bar plotting of the proportion of individual variation of 60 Sarcoptes mite from different host species in Asturias (Spain) collected with 11-years interval, assigned to a given genetic clusters in STRUCTURE, when two (A: K = 2), three (B: K = 3), four (C: K = 4), five (D: K = 5), and six (E: K = 6) populations are assumed in the dataset. Each cluster is represented by a different colour. 1: R. pyrenaica-1997. 2: R. pyrenaica-2008. 3. C. capreolus-2008. 4: C. elaphus-2008. 5: V. vulpes-2008.
