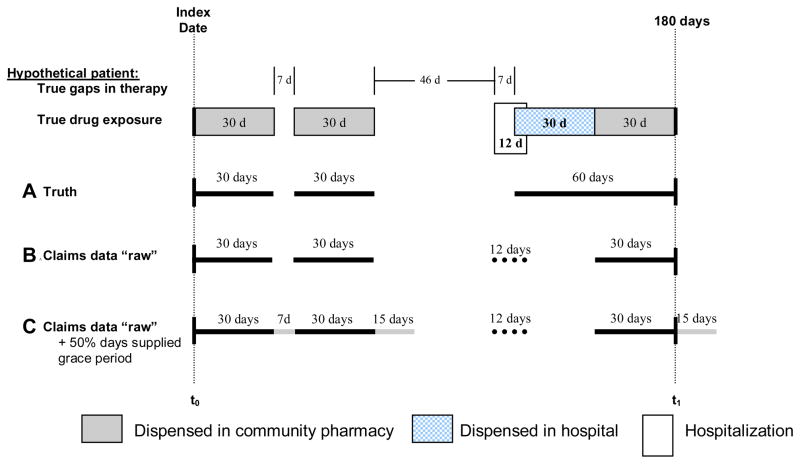
Figure 2.
Example drug exposure and adherence for a hypothetical patient.
A. Truth: dark solid lines=true consumption
B. Claims data “raw”: dark solid lines=drug use identified through pharmacy claims, dotted line=days in hospital identified through medical claims.
C. Claims data “raw” +50% days supplied grace period: dark solid lines=drug use identified through raw pharmacy claims, light solid lines=coverage added by applying a maximum 50% days supplied grace period to all gaps, dotted line=days in hospital identified through medical claims.
t0=start of observation period, t1=end of observation period; calculations only consider drug coverage during the observation period

