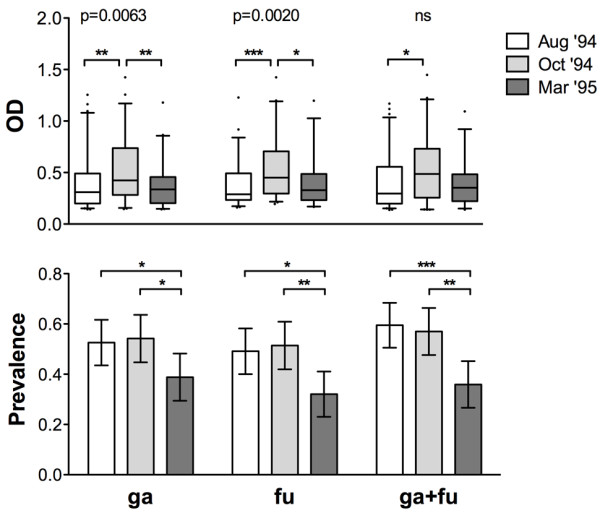
Figure 3.

Seasonal variation of the IgG response to gSG6, fSG6 or their combination. IgG levels and prevalence to the different antigens: ga, gSG6; fu, fSG6; ga+fu, gSG6+fSG6. (Top) Box plot of OD values among responders to the indicated antigen in the different surveys. Box plots display the median OD value, 25th and 75th percentile. Whiskers represent 5-95 percentile and dots the outliers. P value was determined according to Kruskal-Wallis test. Pairwise comparisons refer to Mann-Whitney test (*, 0.01 < p < 0.05; **, 0.001 < p < 0.01; ***, p < 0.001). Number of responders (n) and mean age in years ± 95% CI (in parentheses) were as follows: Aug '94, [ga, n = 61 (15.8 ± 3.3); fu, n = 57 (17.5 ± 4.4); ga+fu, n = 69 (19.1 ± 4.3)]; Oct '94, [ga, n = 58 (16.5 ± 3.6); fu, n = 55 (17.0 ± 3.9); ga+fu, n = 61 (16.4 ± 3.5)]; Mar '95, [ga, n = 40 (15.0 ± 4.7); fu, n = 33 (14.9 ± 5.6); ga+fu, n = 37 (14.7 ± 4.9)]. (Bottom) Seasonal variation of seroprevalence to the different antigens in the three surveys. Whiskers denote the 95% CI. Number of individuals (n) and mean age as follows: Aug '94, n = 116 (20.2 ± 3.3); Oct '94, n = 107 (18.4 ± 2.8); Mar '95, n = 103 (17.8 ± 3.0). P values were determined by chi-square test (*, 0.01 < p < 0.05; **, 0.001 < p < 0.01).
