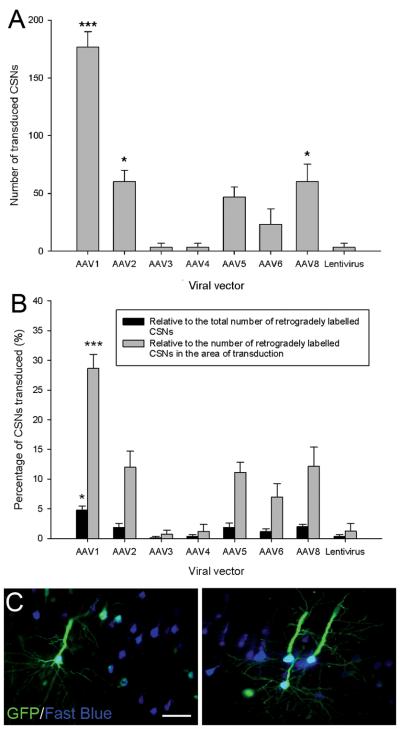
Figure 4.
Transduction of CSNs by seven AAV serotypes and an integration-deficient lentiviral vector. (A) Quantification of transduced CSNs. The CSNs were labelled using the retrograde tracer Fast Blue. The number of GFP and Fast Blue positive neurons was counted and the mean number of transduced CSNs plotted for each viral vector. AAV1 transduced a significantly higher number CSNs than the other viral vectors. Values represent mean and SEM, analysis was performed using one way ANOVA with Tukey post-hoc tests *** P < 0.001, * P < 0.05, n = 3/group. (B) Quantification of the percentage of CSNs transduced relative to both the total number of retrogradely traced CSNs and the number of retrogradely traced CSNs in the area of transduction. Compared to the other viral vectors AAV1 transduced a significantly higher percentage of CSNs relative to the total number of CSNs or the number of CSNs within the area of transduction. Values represent mean and SEM, analysis was performed using one way ANOVA with Tukey post-hoc tests *** P < 0.001, * P < 0.05, n = 3/group. Asterisks show a subset of key significant comparisons; the complete set of significant comparisons is described in Results. (C) High magnification images of AAV1 transduced CST projecting pyramidal CSNs from different animals. Scale bars: 50 μm.

