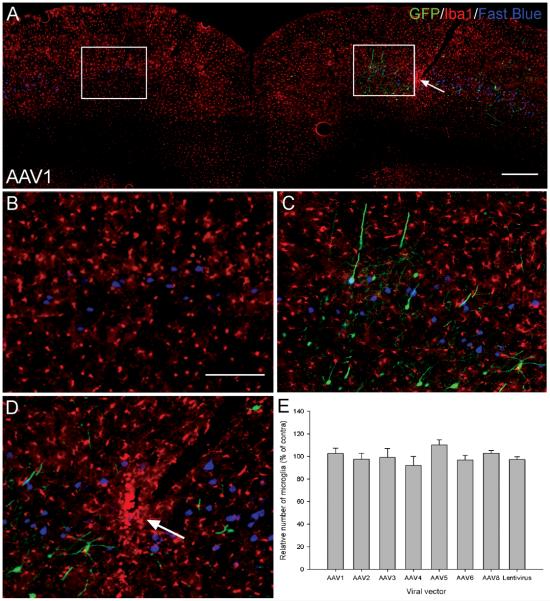
Figure 8.
The viral vectors did not generate a microglial response. (A) An Iba1 stained cortex from an AAV1 transduced rat. No observable difference in Iba1 immunoreactivity was seen between the two hemispheres. The 800 μm × 900 μm boxes used to quantification the number of microglia are shown. Scale bar: 500 μm. (B) Higher-magnification image of the 800 μm × 900 μm box from the uninjected hemisphere in (A). Scale bar: 200 μm. (C) Higher-magnification image of the 800 μm × 900 μm box from the injected hemisphere in (A). (D) Higher-magnification image of the needle track in (A, arrow) showing enhanced Iba1 staining along the needle track as indicated by the arrow. (E) Quantification of the relative number of microglia within the area of transduction. The number of Iba1 positive cells in an 800 μm × 900 μm box placed over each hemisphere was counted, the relative number of microglia, expressed as a percentage of the contralateral hemisphere was then calculated and plotted for each viral vector. Values represent mean and SEM, analysis was performed using one way ANOVA P > 0.05, n = 3/group.

