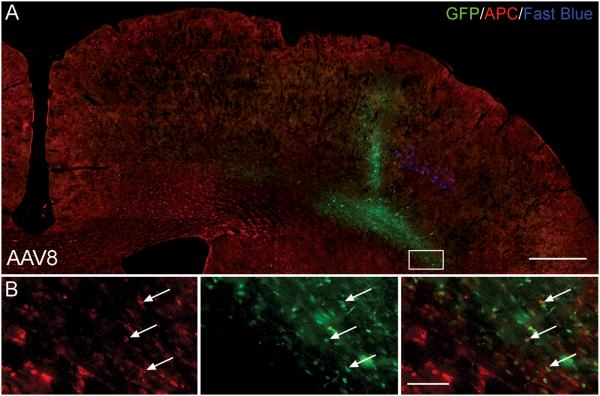
Figure 9.
AAV8 exhibits a potential oligodendrocyte tropism. (A) Cortical hemisphere of an AAV8 transduced rat stained with APC to detect oligodendrocytes. Transduced oligodendrocytes were observed in the white matter tract, although high background staining made quantification unfeasible. Scale bar: 500 μm. (B) Higher-magnification image of box in (A). The left box shows APC positive oligodendrocytes, the middle box shows transduced GFP-positive cells and the right box is a merged image, yellow cells represent transduced APC positive oligodendrocytes (arrows). Scale bar: 50 μm.

