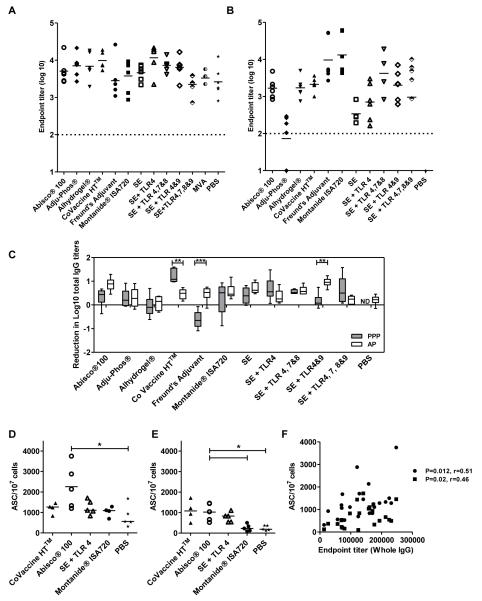
Figure 4. Longevity of vaccine-induced IgG responses.
BALB/c and C57BL/6 mice (n=5-6 / group) were immunized as described previously. IgG titers were measured in the serum ten weeks after the final immunization in response to OVA protein in mice immunized with (A) AP regimes and (B) PPP regimes. Median responses are shown. (C) The reduction in log titers was calculated from IgG titers two weeks post the final immunization in each regime and IgG titers ten weeks after the final immunization. ** p<0.01, *** p<0.001 by two-way ANOVA with Bonferroni’s multiple comparison post-test. Median responses are shown with range. Antibody secreting cells (ASC) per 107 cells in mice immunized with AP regimes were quantified in the (D) bone marrow and (E) spleen ten weeks after the last immunization in response to MSP-119 protein. * p<0.05 by Kruskal-Wallis test with Dunn’s multiple comparison post-test. Median responses are shown. (F) IgG titers two weeks after the last immunization were correlated with antibody secreting cells in the spleen (■) and bone marrow(•) to MSP-119 protein for AP regimes. Spearman’s rank correlation co-efficient is shown. The dotted line indicates the threshold for responses above background in (A) and (B). ND = no data.

