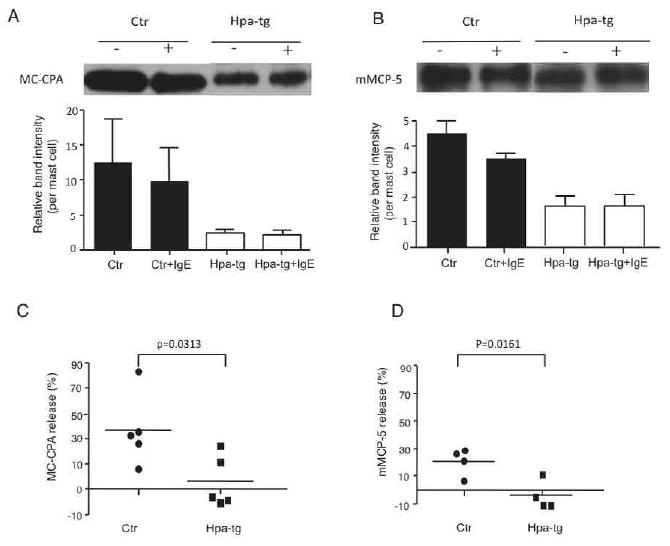
Figure 5.

Detection of proteases in the peritoneal MCs.
Representative Western blot for MC-CPA (A) and mMCP-5 (B) in non-treated (-) or IgE-activated (+) peritoneal MCs. The bands were quantified by Image J and normalized to the MC number in each mouse (n=4-5); the average relative band intensity is shown. Release of MC-CPA (C) and (D) mMCP-5 in response to IgE cross-linking is calculated as: (non-activated- activated)/non-activated ×100%.
