
Fig. 13.
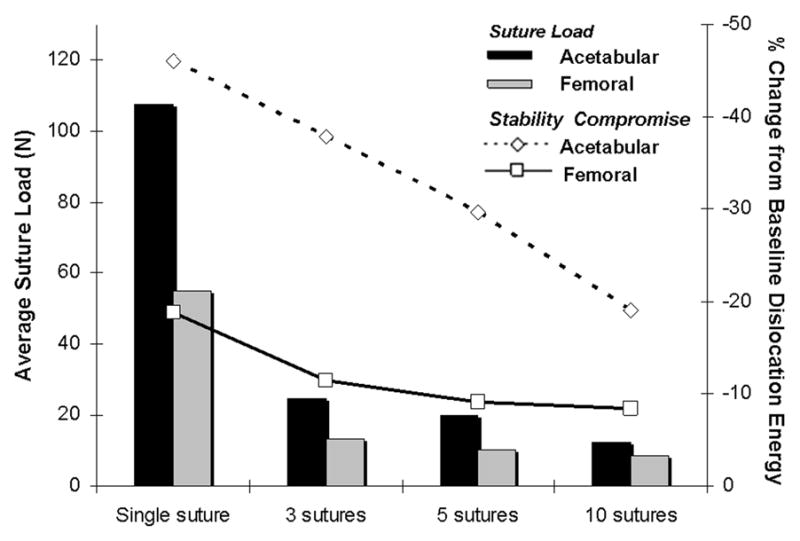
Per-suture tensile loads (bars) developed at simulated femoral and acetabular repair sites for a 3/8- circumference posteriorly centered capsule insertion release for single-suture versus averages for 3-, 5- and 10-suture repairs spaced equally along the defect. Deviations from baseline dislocation dissipation energy are shown (open symbols) for each repair.