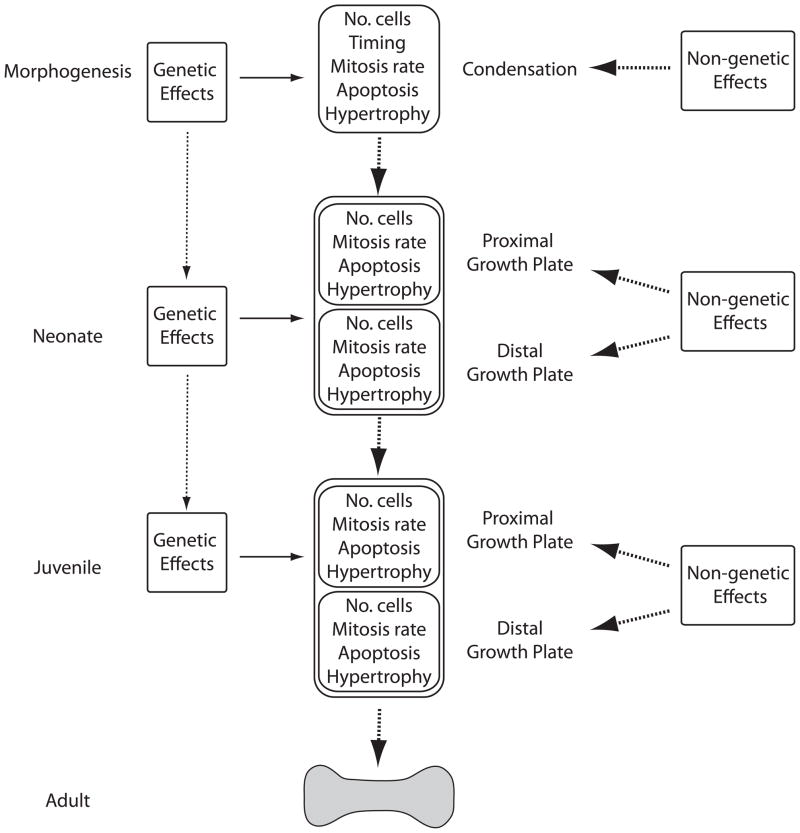
Figure 1.
Simplified version of the Atchley Hall model stressing the key developmental units associated with variation in long bone length at different stages. The heavy arrows represent genetic interactions between stages while the light arrows represent the influence of the stage-specific environments on the developing long bone. The complete complement of genetic and non-genetic effects is best modeled in Fig. 2.

