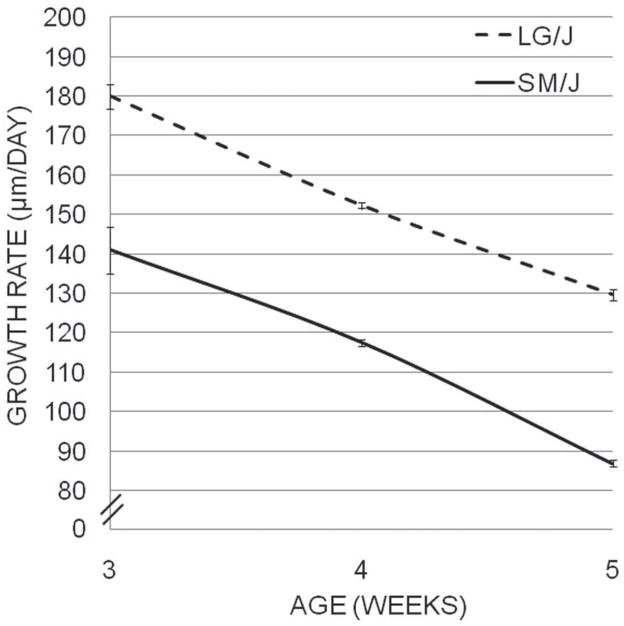
Figure 6.
The proximal tibial growth rates (μm/day) of the LG/J (dotted line) and SM/J (solid line) strains of mice from 3–5 weeks of age are plotted. Growth rates were determined by oxytetracycline injection and subsequent histological measurement of the proximal tibiae of animals at 3, 4, and 5 weeks of age (n = 5–7 animals, listed in Table 7).

