
Figure 1.
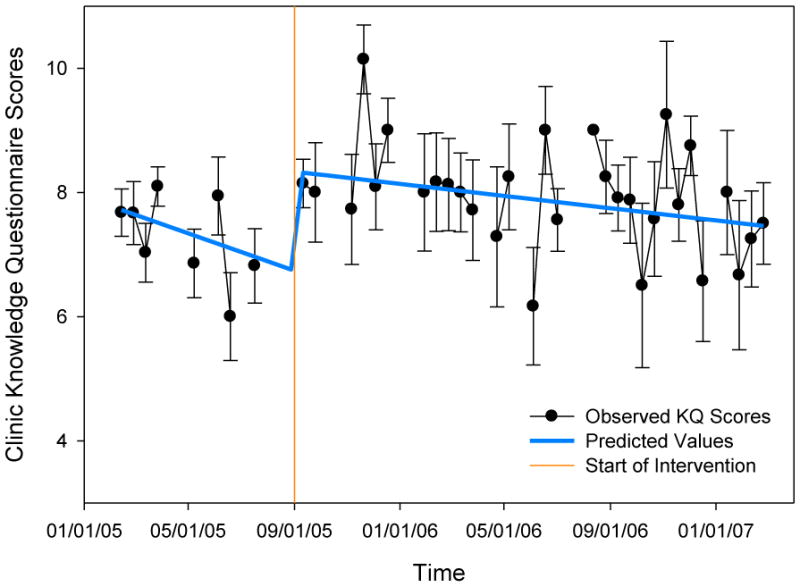
Average scores on the 11-item knowledge questionnaire per biweekly interval are displayed, where standard errors around the mean are represented by error bars. The predicted values of the “gradual change” model, the best fitting model, are displayed in by the thick line.