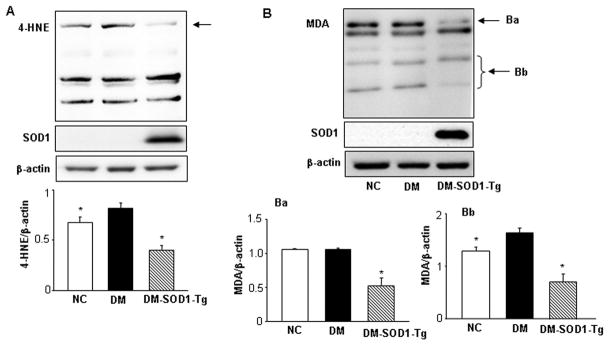
Figure 3.
SOD1 overexpression blocks maternal hyperglycemia-induced lipidperoxidation. The upper panels of A and B showed representative images of 4-HNE and MDA Western blotting, respectively. The lower panel of A was the graphic data of densitometric analysis of the bands which were pointed by the arrow. In panel B, Ba and Bb pointed specific bands which were quantitatively graphed in the underneath bar graphs (Ba and Bb). β-actin served as an equal protein loading control. NC: non-diabetic WT control. DM: Diabetic WT and DM-SOD1-Tg: diabetic SOD1 Tg. Data expressed as Mean ± standard errors (SE) (n = 3). * denotes significant difference (p<0.05) when compared to the DM group.

