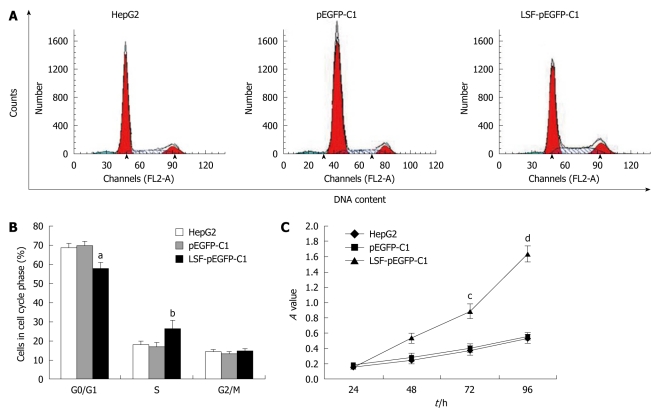
Figure 4.
Effects of late SV40 factor overexpression on cell growth and the cell cycle of HepG2 cells. The cell-cycle profile was determined as the percentage of cells in the G0/G1 stage of the cell-cycle. Untransfected and transfected cells were harvested by trypsinization and fixed in 70% ethanol. A: Results of a representative experiment; B: Mean ± SE of 3 independent experiments (aP < 0.01, bP < 0.01 vs the other groups); C: Cell viability of the indicated cells at the indicated time points measured using a standard 3- (4,5-cimethylthiazol-2-yl)-2,5-diphenyl tetrazolium bromide assay. Data represent the mean ± SE (cP < 0.01, dP < 0.01 vs the other groups).

