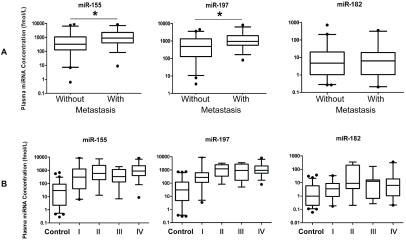
Figure 5.
Correlation of plasma levels of miRNAs and patient clinical status. (A) Box plots of plasma levels of miR-155, miR-197 and miR-182 in lung cancer patients without metastasis (n=44) or with metastasis (n=30). Note: *, P<0.05. (B) Box plots showing plasma levels of miR-155 (left panel), miR-197 (middle panel) and miR-182 (right panel) in control subjects (n=68) and lung cancer patients with different TNM stages (I, n=21; II, n=12; III, n=11; IV, n=30). The lines inside the boxes denote the medians. The boxes mark the interval between 25th and 75th percentiles. The whiskers denote the interval between the 5th and 95th percentiles. Filled circles indicate data points outside the 5th and 95th percentiles.

