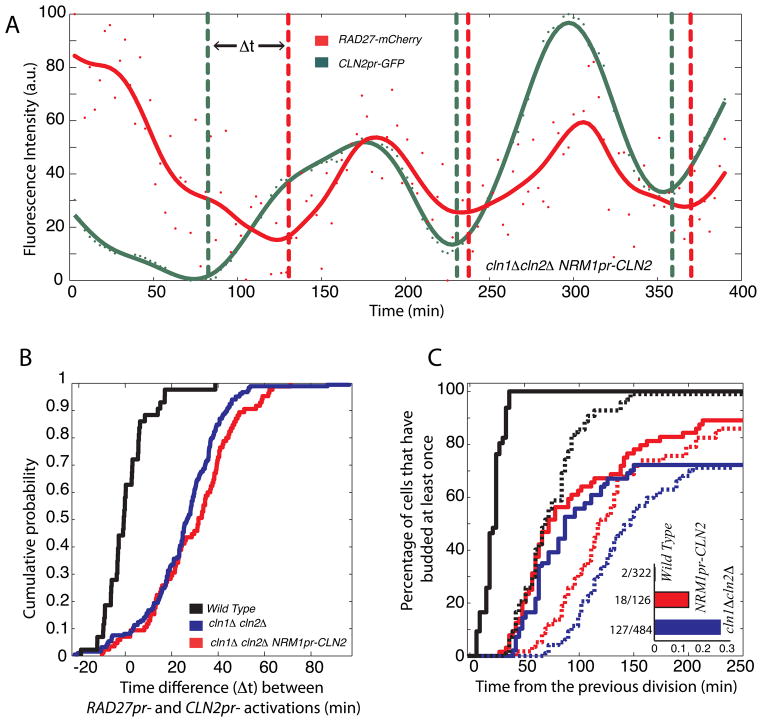
Figure 2. Phenotypic consequences of delayed positive feedback.
(A) Time course of incoherent RAD27-mCherry and CLN2pr-GFP expression in a single cln1Δ cln2Δ NRM1pr-CLN2 cell. (B) Time difference between CLN2pr and RAD27pr induction measured as in Skotheim et al (2008); cells not showing significant induction of either promoter were omitted from the analysis. (C) A cumulative plot for the first bud emergence measured from cell division. Solid and dashed lines correspond to mother and daughter cells respectively. Inset shows fraction of G1-arrested cells.

