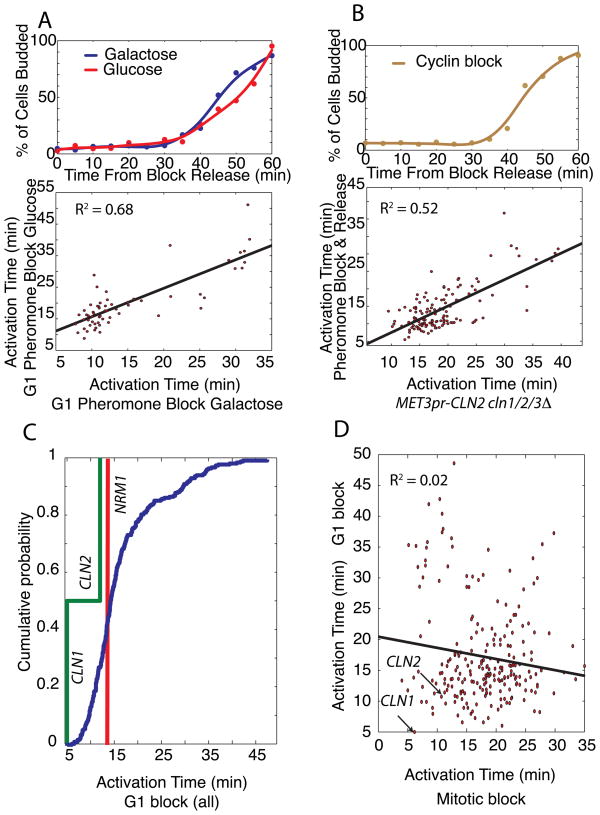
Figure 3. Synchronization phase, but not carbon source or synchronization method, affects gene activation timing.
(A) Bud-index measurements and gene activation time correlation for G1 pheromone block-release time-course microarray experiments with glucose or galactose carbon sources. (B) Bud index for G1 block-release using cln1Δ cln2Δ cln3Δ MET3pr-CLN2 cells and correlation of gene activation times for pheromone and G1 cyclin block-release experiments. (C) Significant correlation between the 3 G1 block-release datasets allows them to be pooled together to produce a histogram of activation times for the G1/S regulon again demonstrating feedback-first regulation. (D) Activation times from G1 and mitotic block-release experiments are not correlated.

