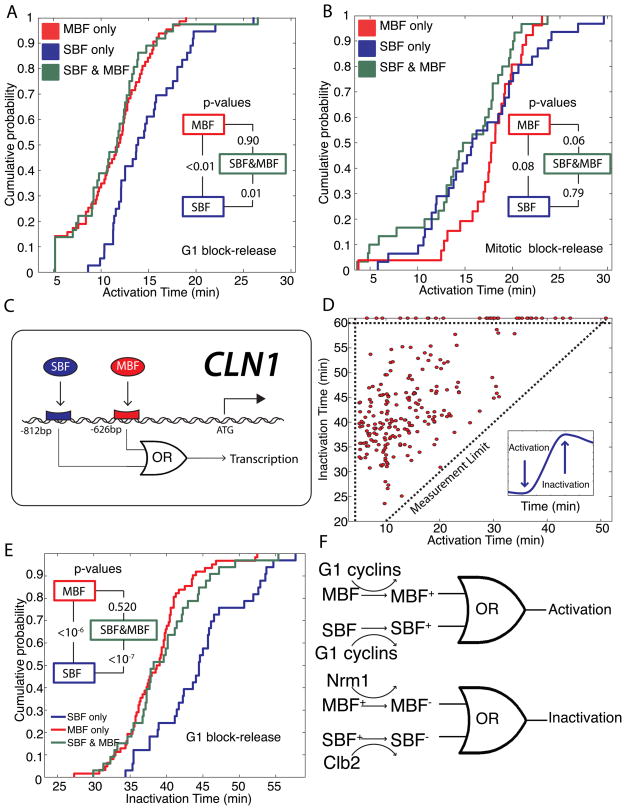
Figure 5. SBF and MBF dual-regulated promoters act as logical OR gates in response to activation and inactivation signals.
Cumulative probability of activation times for SBF-only, MBF-only and SBF/MBF dual-regulated targets are plotted for (A) G1 block-release and (B) mitotic block-release experiments. Inset shows p-values comparing each pair of distributions. (C) Schematic showing logical regulation of the early-activated CLN1 promoter denoting SBF and MBF consensus binding sites. (D) Inactivation time for each gene, where the 1st derivative is zero and the 2nd derivative is negative (inset), is uncorrelated with activation for G1 block-release experiments. Points above the horizontal dotted line represent genes peaking later than 60 min. (E) Cumulative probability of inactivation for SBF-only, MBF-only and SBF/MBF dual targets for G1 block-release experiments. Inset shows p-values comparing each pair of distributions. (F) The transcriptional activation and inactivation can be modeled as a logical OR gate. For dual-regulated genes, activating either SBF or MBF suffices for activation, while inactivating MBF suffices for inactivation. Different colors denote different possible states of a transcription factor.

