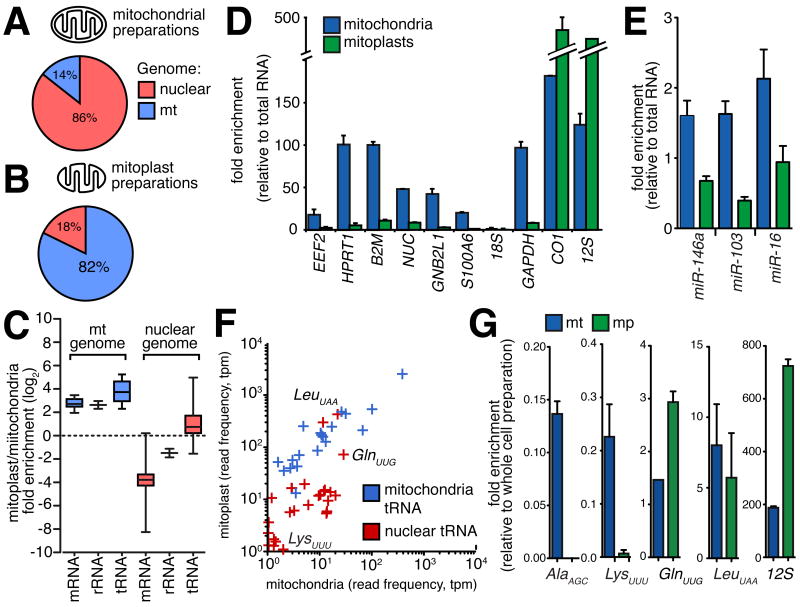
Figure 3.
(A,B) Relative enrichment of nuclear-encoded RNAs in mitochondria or mitoplast preparations. Proportion of sequenced reads aligning to nuclear (red) and mitochondrial (blue) genomes in libraries derived from mitochondria (A) and mitoplast (B) preparations. Comparison between libraries indicates the depletion of co-purifying contaminant transcripts in mitoplast preparations. (C) Box whisker plot indicates enrichment for mitochondrial encoded (blue) mRNAs, rRNA and tRNA in mitoplast relative to whole mitochondrial RNA preparations. While the majority of nuclear-encoded (red) mRNAs and rRNAs are depleted in mitoplast preparations, nuclear tRNAs are enriched in mitoplasts. (D,E) qRT-PCR confirmation for mitoplast depletion of mRNAs (D) and miRNAs (E) for which we observed the highest expression in whole mitochondrial preparations. (F) Scatter-plot indicating the normalised expression for nuclear (red) and mitochondrial (blue) tRNAs, showing the enrichment of several nuclear tRNAs, including tRNA-LeuUAA (p-value<0.001) and tRNA-GlnUUG (p-value=0.003) in mitoplasts. (G) qRT-PCR shows the depletion of nuclear tRNA-AlaAGC and tRNA-LysUUU in mitoplasts, and enrichment of tRNA-GluUUG (p-value=0.025) and presence of tRNA-LeuUAA within mitoplasts. 12S rRNA included as positive control (all error bars indicate SEM).

