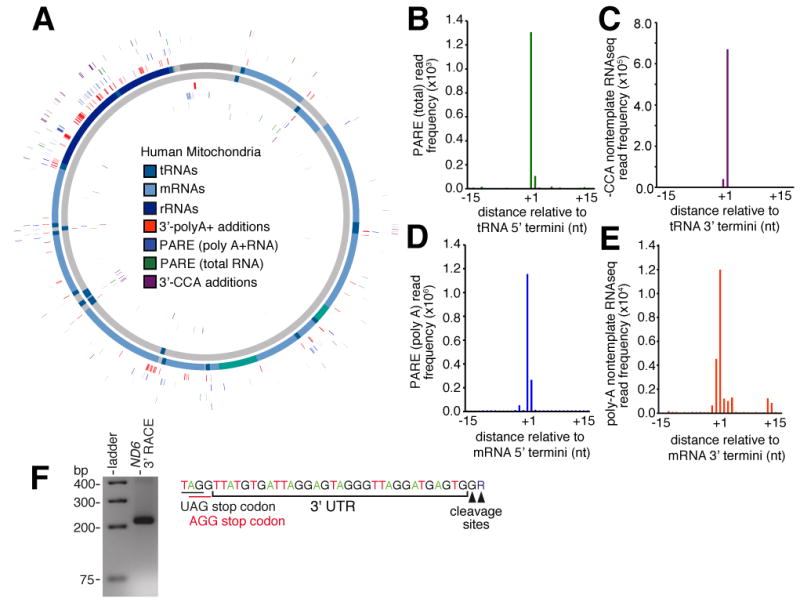
Figure 4.

(A) Mitochondrial position of 5′ cleavage sites. Cleavage sites determined by PARE with total (green) and polyA+ (blue) human RNA and 3′ cleavage sites determined by RNAseq reads containing non-template –CCA (purple) and polyA additions (orange) are indicated. (B-E). Frequency distribution of (B) PARE reads from total RNA across window centred on annotated tRNA 5′ end, (C) non-template –CCA sites across window centred on annotated tRNA 3′ end. (D) Frequency distribution of PARE reads from poly-A+ RNA across window centred on annotated mRNA 5′ end, (E) non-template poly-A sites across window centred on annotated mRNA 3′ end. (F) Annotation of ND6 3′UTR by 3′ RACE. The 3′UTR sequence with stop codon (black) and -1 shifted codon (red) is indicated (top panel). Gel electrophoresis of product retrieved from ND6 3′RACE shown in lower panel.
