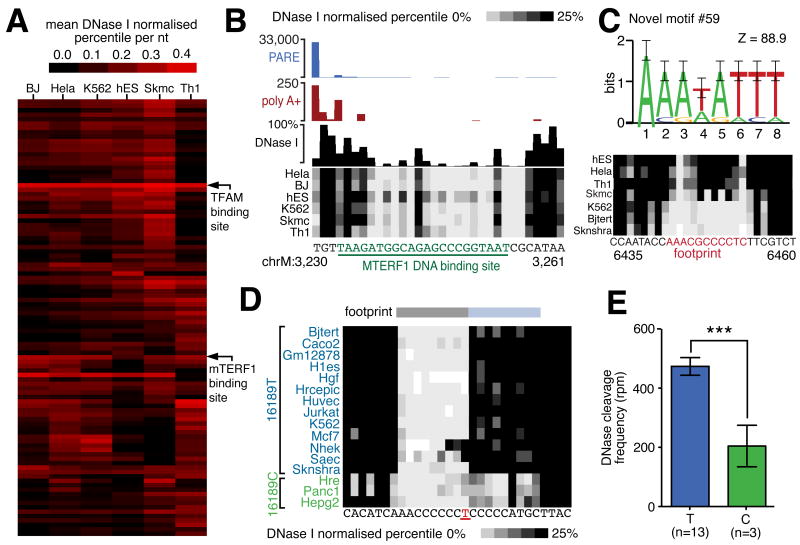
Figure 7.
(A) Hierarchical cluster diagram indicating the sensitivity of top 100 indentified DNaseI footprints. Footprints corresponding to TFAM and MTERF1 biding sites are indicated. (B) DNaseI footprint at mTERF binding site. Cleavage events associated with transcription termination are indicated by PARE (blue histogram) and non-template polyadenylation RNAseq reads (red histogram). DNaseI cleavage frequency in HeLa cells indicated by black histogram and frequency in other cell lines indicated by density plot. Underlined green nucleotides indicate MTERF1 binding. (C) Commonly recurring novel sequence motif #59 (top panel; error bars show twice sample correction according to WebLogo; Crooks et al., 2004) and example of novel cell-specific footprint (bottom panel) (D) Association of T16189C SNP variant with distorted footprint. An extended footprint (blue bar) is present in 3 cell lines with C variant (green) but absent in cell lines with T variant (blue). (E) Histogram indicates significant increase in DNaseI cleavage frequency in cell lines containing variant 16189T allele as compared to 16189C allele (error bars indicate SEM).

