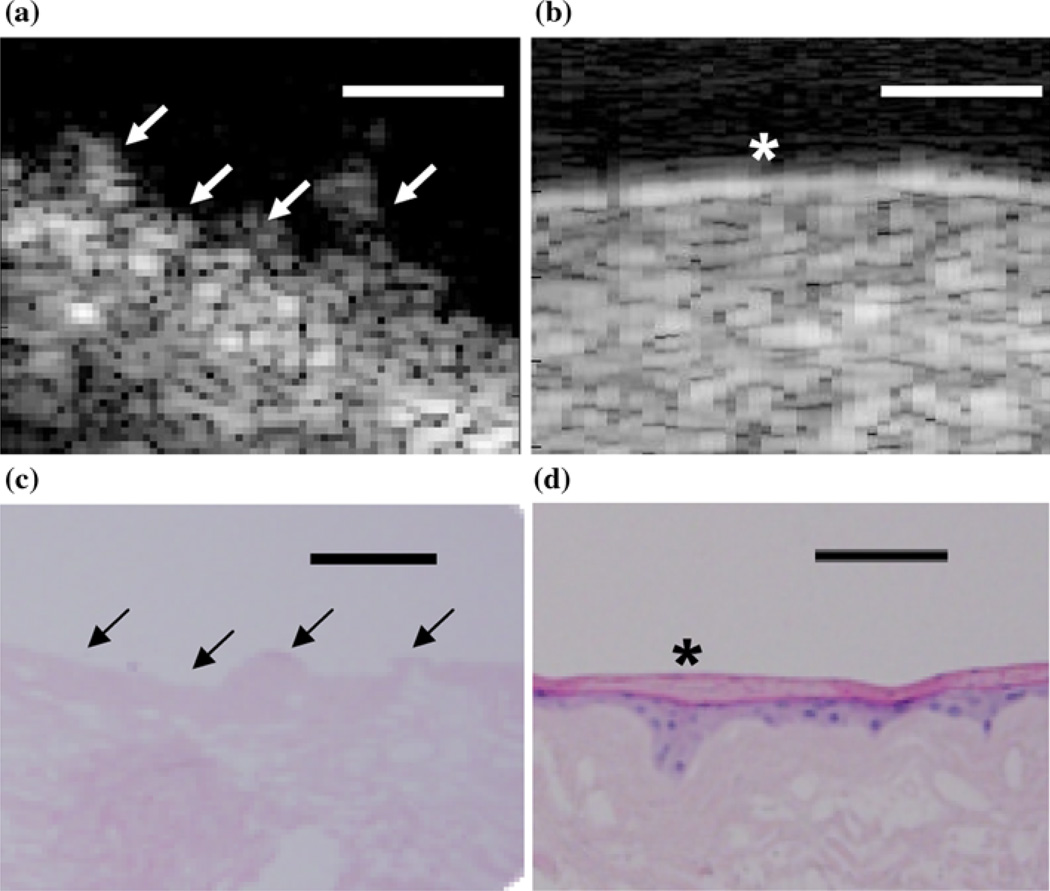
FIGURE 2.
2D B-scan images of the untreated AlloDerm® device (a) and EVPOME at 11 days post-seeding (b). Surface irregularities (arrows) are clearly present on the AlloDerm® compared to the EVPOME; the latter shows a brighter surface reflection (asterisk), the result of the differentiating keratinocytes. The corresponding histology images for the untreated AlloDerm® device (c). The EVPOME at 11 days post-seeding (d) also show a high number of surface irregularities (arrows) on the former compared to the keratinized layer (asterisk) on the EVPOME surface. Scale bars represent 100 µm.

