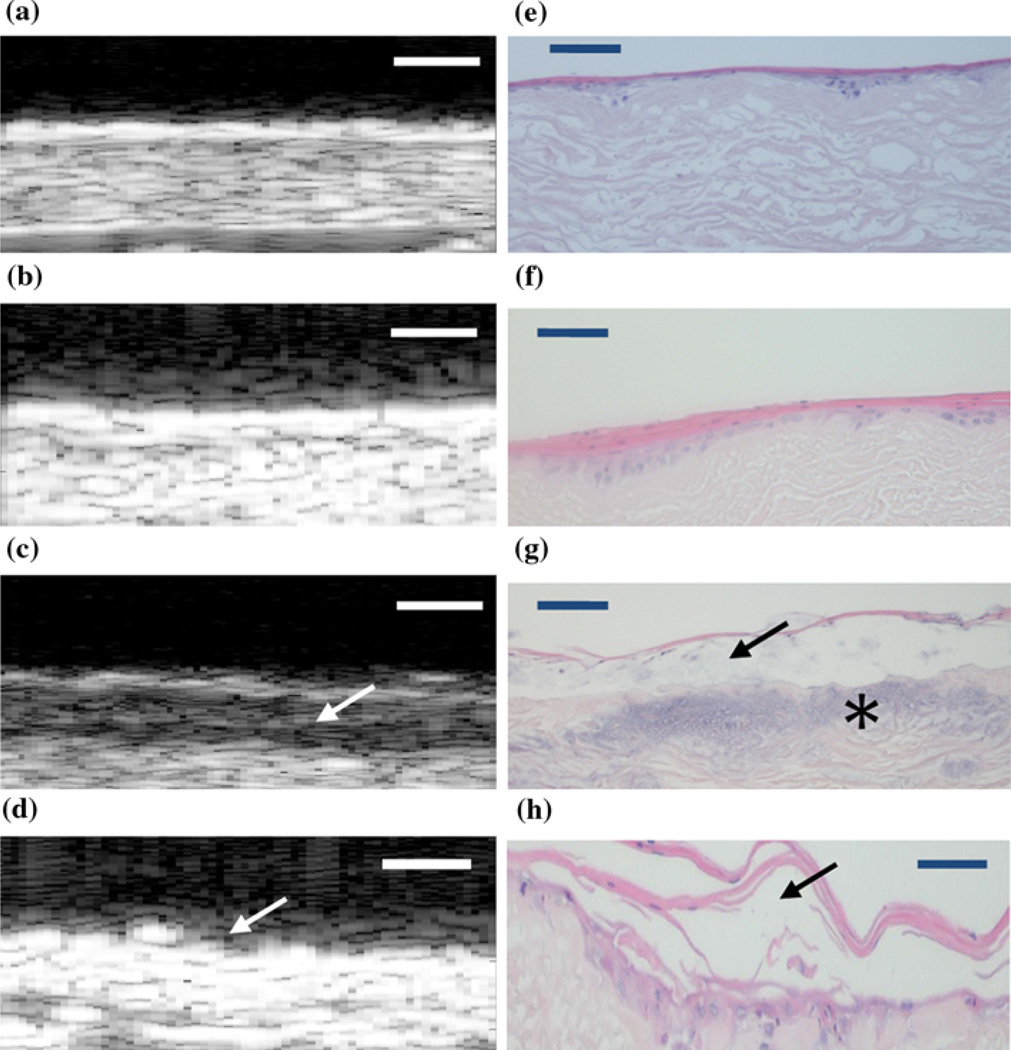
FIGURE 3.
2D B-scan composites of the EVPOME devices for both the thermally unstressed (a–b) and stressed (c–d) groups. The corresponding histology micrographs of both unstressed (e–f) and stressed devices (g–h) compare the conditions of the keratinized surfaces for both imaging modalities. Comparing (c) with (g), there is a clear partitioning (arrows) between the keratinized layer and the device due to the heat stress; evident in the darkened region of the B-scan image (arrow). For (d), the irregular surface of the AlloDerm® device is visible (arrow), but no keratinized layer; the likely result of the keratin layer sloughing off from the device surface. For (g), the blue staining on the device (asterisk) is a result of excessive hematoxylin used in their preparation and not a result of the thermal treatment. Device surfaces are at the top of each image. Scale bars represent 100 µm.

