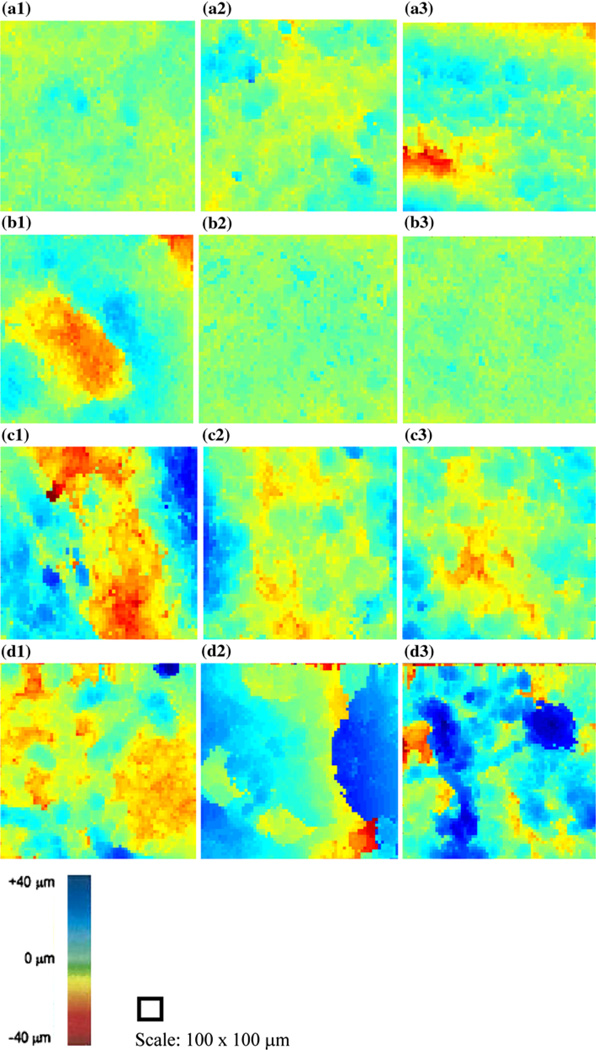
FIGURE 4.
RMS profilometry images for each scan performed on the thermally non-stressed (a–b) and stressed (c–d) devices. For the latter, there is higher variation in the surface features—presumably from the thermal stress fractionating the keratinized layer. With the non-stressed devices, there is little variation in the surface profiles, characteristic of the uniformity of the keratin layer on their surfaces.

