Figure 1.
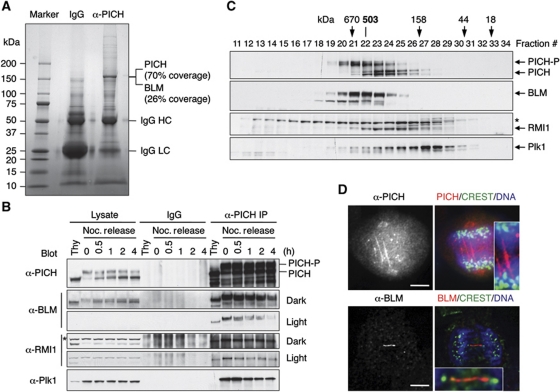
Identification of BLM as a PICH-binding protein. (A) Control IgG and anti-PICH IP from HeLa Tet-On cells were resolved by SDS–PAGE and stained with colloidal Coomassie blue. The molecular mass of markers is labelled. The sequence coverage of PICH and BLM in mass spectrometry is indicated. (B) Lysates, control IgG IP, or anti-PICH IP of HeLa Tet-On cells arrested in G1/S by thymidine (Thy) or at different times (hours) following the release from nocodazole-triggered mitotic arrest were blotted with the indicated antibodies. A cross-reacting band in the α-RMI1 blot is indicated with an asterisk. The positions of hyperphosphorylated and hypophosphorylated PICH are labelled. Light exposures of the α-BLM and α-RMI1 blots are included to better reveal their decrease in PICH binding during mitotic exit. (C) Lysates of nocodazole-arrested mitotic HeLa cells were fractionated on a Superose 6 column. The fractions were analysed by SDS–PAGE followed by immunoblotting with the indicated antibodies. The positions of hypophosphorylated and hyperphosphorylated forms of PICH are labelled. The faster migrating band in the α-BLM blot is derived from BLM, as it was depleted by BLM siRNA. A cross-reacting band in the α-RMI1 blot is indicated with an asterisk. The elution positions of the molecular mass standards are indicated. (D) HeLa Tet-On cells in anaphase were stained with anti-PICH or anti-BLM along with CREST (a centromere marker) and DAPI (stains DNA). In the overlay images, anti-PICH/BLM staining is in red. CREST staining is in green. DAPI staining is in blue. The PICH and BLM threads are magnified in the insets. Scale bars, 5 μm.

