Figure 1.
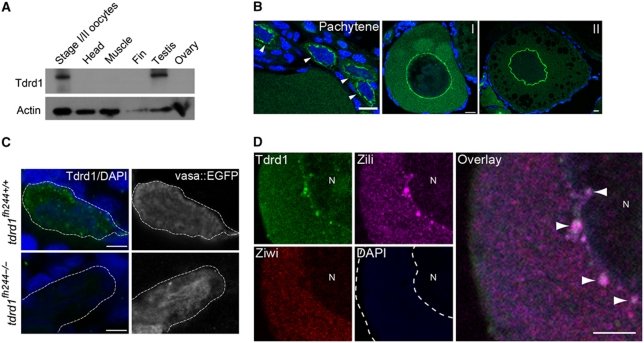
Tdrd1 expression in zebrafish. (A) Western blot analysis of Tdrd1 in diverse tissues. (B) Immunohistochemistry on ovary. Arrowheads indicate pachytene stage oogonia. Scale bars are 10μm. I, II: oocyte stage. (C) Immunohistochemistry on PGCs in 4 days post fertilization (dpf) embryos. Vas::EGFP expression marks PGCs. Green: Tdrd1. Blue: DAPI. Scale bars are 10 μm. Dashed line outlines a single PGC. (D) Co-staining of Ziwi, Zili and Tdrd1 in stage I oocyte. N: nucleus. Arrowheads: sites of colocalization. Scale bar is 5 μm. Green: Tdrd1. Red: Ziwi. Magenta: Zili.

