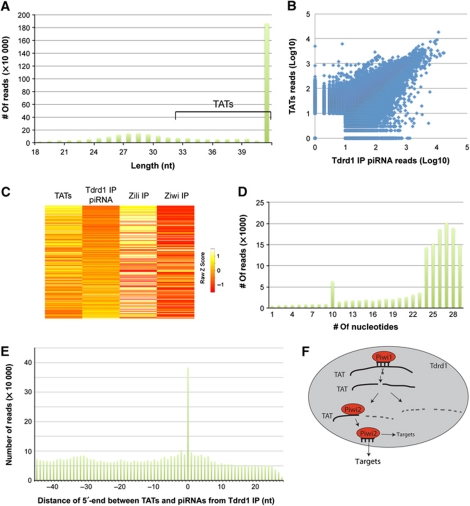
Figure 6.
Tdrd1-associated transcripts (TATs). (A) Length distribution of repeat-derived sequences isolated from a Tdrd1 IP. Significant tailing of the piRNA peak indicates the presence of RNA species longer than mature piRNAs. We name these TATs. TATs of 46 bases and longer are used in further analysis. (B) Scatterplot displaying read counts for TATs (Y axis) and Tdrd1-associated piRNAs (X axis) for individual loci. A locus is defined as a region of the genome covered by at least 10 piRNAs and/or long RNAs, allowing for 100 base-pair gaps. Correlation coefficient R=0.72. (C) Heatmap showing strand biases of piRNAs from individual transposons in the indicated libraries. Map is relative from left to right and is sorted on strand ratios of Tdrd1-associated piRNAs. Low Z-score (red) indicates relative enrichment for antisense reads. (D) Number of transposon-derived Tdrd1-associated piRNAs (Y axis) that have a 5′-end overlap (X axis) with TATs from the opposite strand. (E) Bar diagram displaying the distance between the 5′-ends of TATs and Tdrd1-associated piRNAs from the same genomic strands. X axis reflects the most frequent distance of 5′-ends between any TAT species compared with all overlapping piRNAs. Y axis displays how often each distance is observed. (F) A schematic model displaying how TATs (solid black lines) may interact with Piwi proteins within a Tdrd1 environment. TATs may be base paired to piRNAs, may be cleavage products on their way to further destruction or may be bound by Piwi proteins to be processed further into mature piRNAs or any combination thereof.

