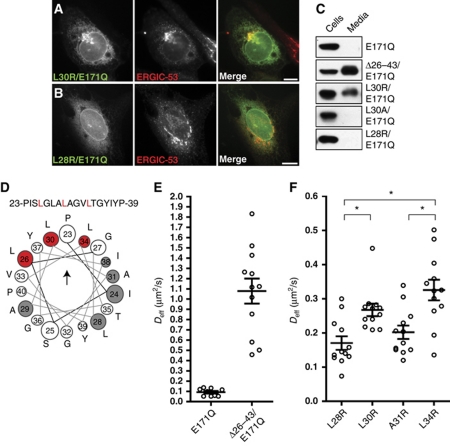
Figure 6.
ER retention correlates with membrane association. (A, B) Epifluorescence microscopy of E171Q–torsinA–mGFP with the indicated mutations, costained with ERGIC-53. Scale bars, 10 μm. (C) Immunoblot of cell lysates or media immunoprecipitates from cells expressing the indicated torsinA–mGFP constructs. (D) Helical wheel plot summarizing the results of nonconservative mutations placed throughout the NTD. Sensitive residues marked in red, insensitive residues marked in grey, and untested residues marked in white. See Supplementary Figure S3 for supporting data. Arrowhead indicates direction of hydrophobic moment of wild-type sequence (μH=0.22). (E, F) Diffusion coefficients of the indicated mutations in E171Q–torsinA–mGFP determined by FRAP. (E) E171Q, 0.09±0.01 μm2/s, n=9; E171Q/Δ26–43, 1.08±0.12 μm2/s, n=12. (F) L28R, 0.17±0.02 μm2/s, n=12; L30R, 0.27±0.02 μm2/s, n=12; A31R, 0.20±0.02 μm2/s, n=12; L34R, 0.33±0.03 μm2/s, n=12. Mean and s.e.m. values are indicated by lines and brackets. *P<0.05; L28R versus A30R, A31R versus L34R, and L28R versus L34R are significantly different, as determined by ANOVA followed by Tukey's post test.

