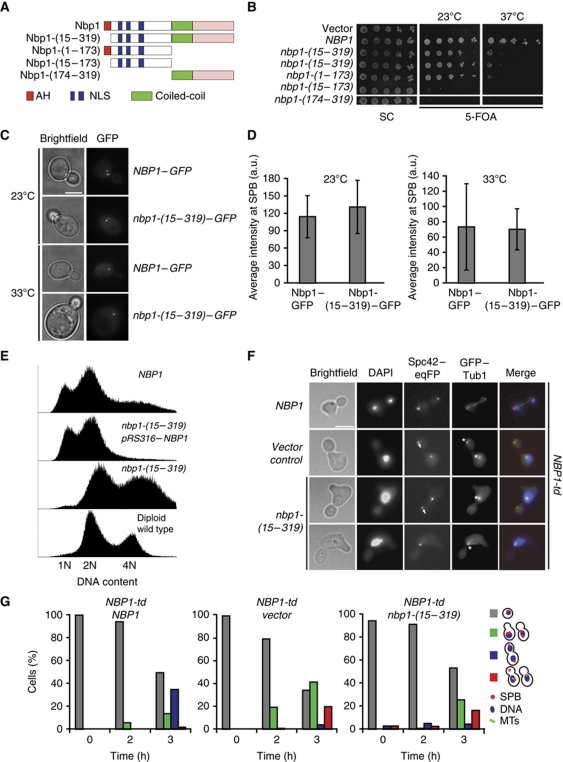
Figure 4.
The AH of Nbp1 is essential for insertion of the SPB. (A) Schematic representation of Nbp1 domains and deletion constructs. Red: AH, amphipathic α-helix; blue: NLS1 and NLS2; green: coil-coiled; pink: C-terminal domain of NBP1. (B) Test of functionality of NBP1 constructs of (A). Five-fold serial dilutions of nbp1Δ pRS316–NBP1 cells with the indicated NBP1 integration plasmids were incubated at 23 and 37°C on 5-FOA and SC plates. (C) SPB localization of the indicated GFP constructs in cells. (D) Quantification of SPB signal of NBP1–GFP and nbp1-(15–319)–GFP cells. Ten SPBs in six different cells were analysed. (E) DNA content of the indicated cells grown at 23°C as determined by FACS analysis. (F) NBP1-td cells with NBP1, vector or nbp1-(15–319) were synchronized with α-factor at 23°C and released from G1-arrest in YPR medium containing galactose at 37°C. Samples were taken every hour, fixed, stained with DAPI and analysed for spindle formation and the occurrence of a ‘dead pole’. Pictures taken after 3 h at 37°C are shown. Arrows and asterisks mark ‘dead pole’ and monopolar spindle, respectively. (G) Quantification of cells of (F). Cells were categorized according to DAPI signal as indicated in the cartoons on the right (red dot, SPB; blue circle, DNA; green lines, microtubules). Red bars in the histogram represent the percentage of cells with monopolar spindle or ‘dead pole’. Grey bar, non-budded cells; green bar, budded cells with one DAPI signal; blue bar, large-budded cells with two DAPI signals and two functional SPBs. N⩾100 cells were analysed per time point.

