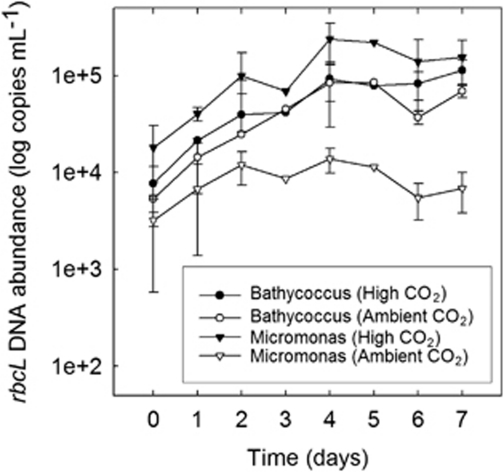
Figure 3.
Temporal variability in log mean (±s.e., n=3) Bathycoccus-like and Micromonas-like rbcL copies ml−1 determined by quantitative PCR between the start of the experiment on day 0 and the observed peaks in chlorophyll concentrations on day 7. The data presented are biological replicates from the two treatments with the exception of days 3 and 5 on which only mesocosm 2 (high CO2) and 5 (ambient CO2) were sampled.

