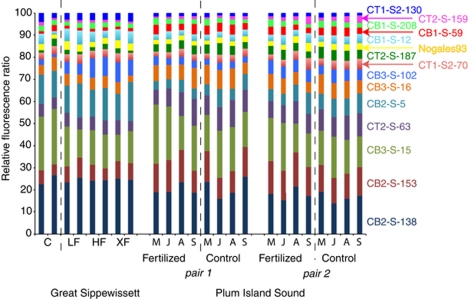
Figure 4.
Stacked bar plot of the magnitude of the hybridization signal of the 15 most abundant nirS targets from GSM and PIE. The RFR indicates the relative signal strength of that archetype in each sample. Analysis of variance results indicate no significant differences between control and fertilized marshes in either experiment (GSM: F=0.846, P=0.471; PIE: F=0.115, P=0.734).

