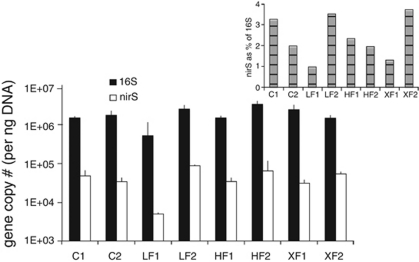
Figure 5.
Quantitative PCR results comparing the absolute abundance of nirS genes in DNA from each of the GSM plots with the absolute abundance of the 16S rRNA genes in the same plots. Inset: the % of 16S rRNA that is nirS. There were no significant differences among treatments with respect to gene copy number for either 16S (F=1.11, P=0.37) or nirS (F=0.08, P=0.96), although the difference between the abundance of nirS and 16S were clearly different from each other (F=91.07, P<0.01).

