
Figure 2.
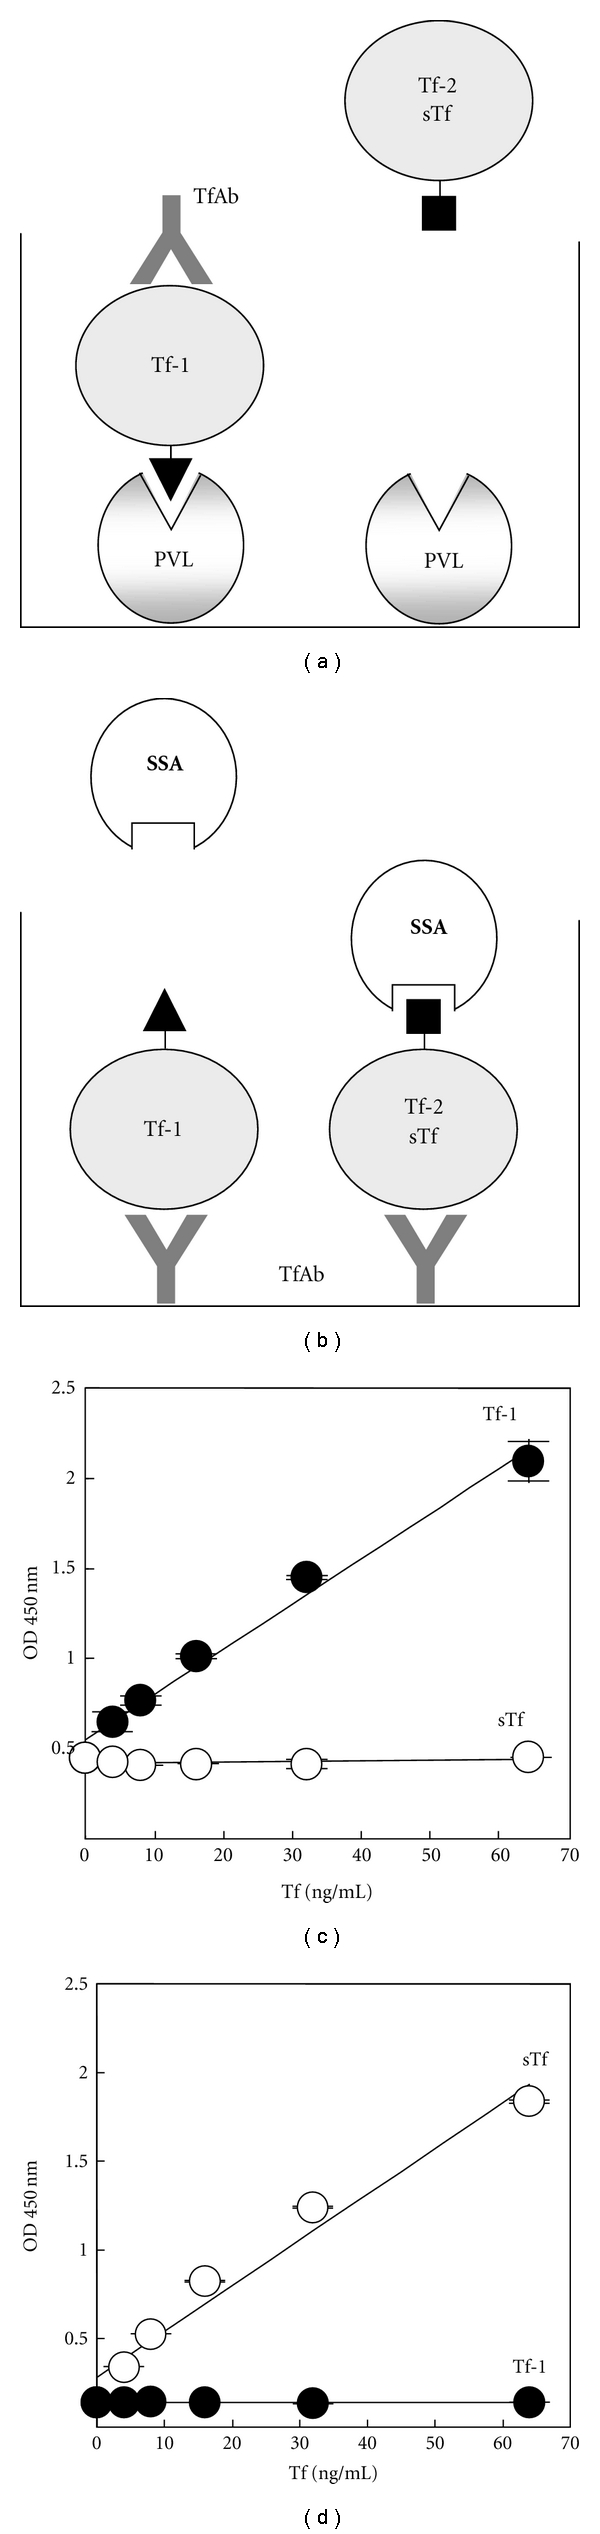
PVL-TfAb ELISA and SSA-TfAb ELISA specifically detect Tf-1 and Tf-2/serum Tf (sTf), respectively. (a) and (b). Schematic representation of lectin-TfAb ELISAs. PVL-TfAb ELISA (a) detects only Tf-1 while SSA-TfAb ELISA (b) detects only Tf-2/sTf. Closed triangles and rectangles represent “CSF-type” and “serum-type” glycans on Tf, respectively. (c) and (d) both the purified Tf-1 and serum Tf were measured in PVL-Tf ELISA (c) and SSA-TfAb ELISA (d). ODs at 450 nm were plotted at each concentration of each Tf. Closed and opened circles show the Tf-1 and serum Tf, respectively.