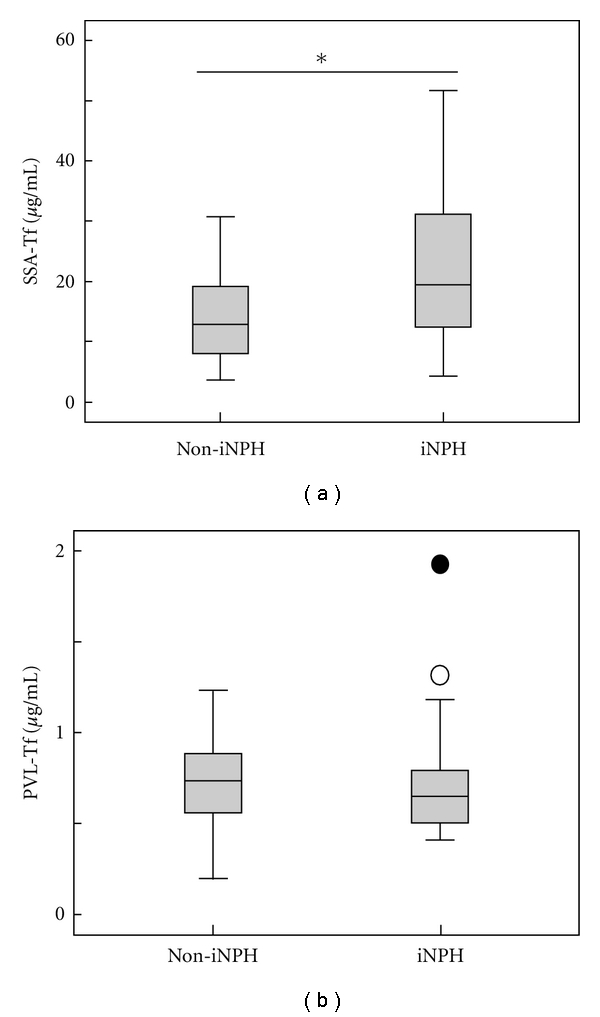
Figure 3.

The SSA-Tf is increased in iNPH patients. Concentrations of SSA-Tf (a) and PVL-Tf (b) were measured in CSF of non-iNPH (n = 18) and iNPH (n = 28) patients, and box plots were shown. An asterisk indicates significantly different (P < 0.05). An open and closed circle represent an outlier and an extreme value, respectively.
