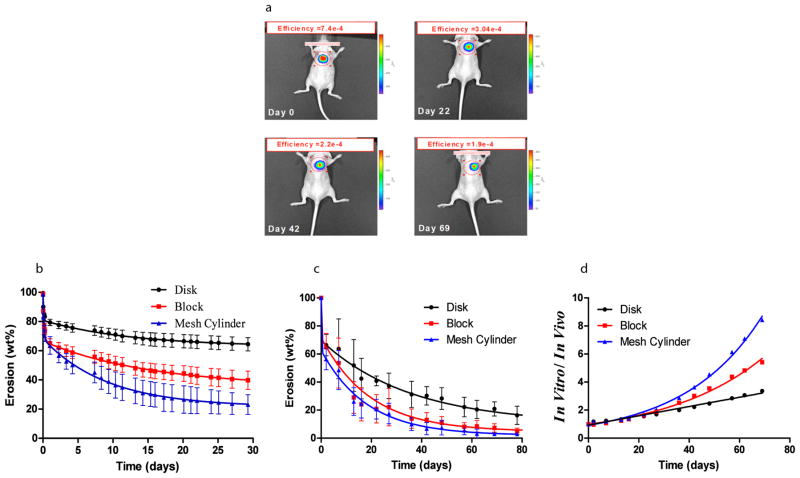
Figure 1. In vitro – in vivo correlation of PEG:dextran erosion profiles exists and varies with material surface area.
In vitro and in vivo erosion profiles of PEG-dextran (D10-50-14 P8-10-40) cast in a series of shapes are depicted by tracking the loss of fluorescence intensity with time. The effect of material shape on degradation profile was followed in vivo noninvasively in the dorsal subcutaneous space of the mouse (disk shaped materials are presented) (a), and in vitro (b). The loss of fluorescent signal with time in vivo was converted to weight loss (c) and correlated with the in vitro loss (d). An excellent correlation was found between mean values of in vitro and in vivo erosions of disk ; (R= 0.96), block ; (R= 0.94), and mesh cylinder ; (R= 0.98). Disk erosion in vivo tracked linearly with erosion in vitro (Figure 1d, R= 0.98). Thin blocks and mesh cylinders with significantly higher surface area than the disks (116, 190 and 86mm2 respectively) showed accelerated erosion in vitro compared with the erosion in vivo, leading to exponential dependence of the ratio between in vivo and in vitro erosion with time (Figure 1d, R= 0.99 for both shapes).

